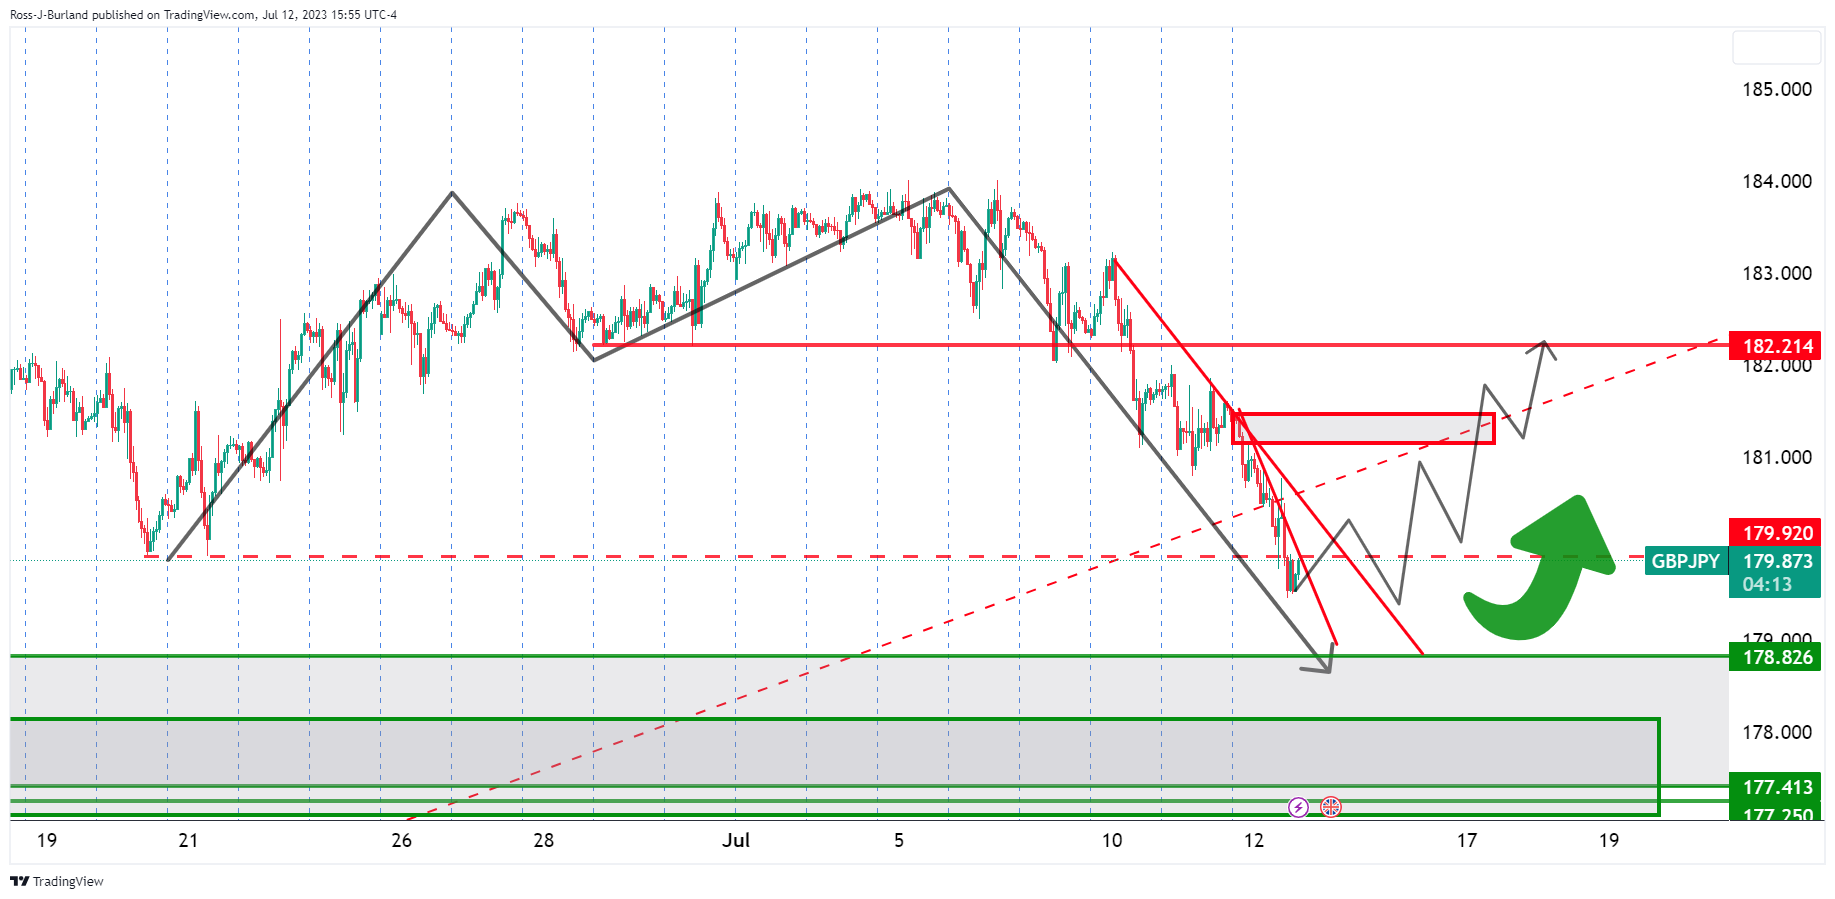
- GBP/JPY bulls have stepped in on the lower time frames.
- Bulls eye a daily M-formation neckline.
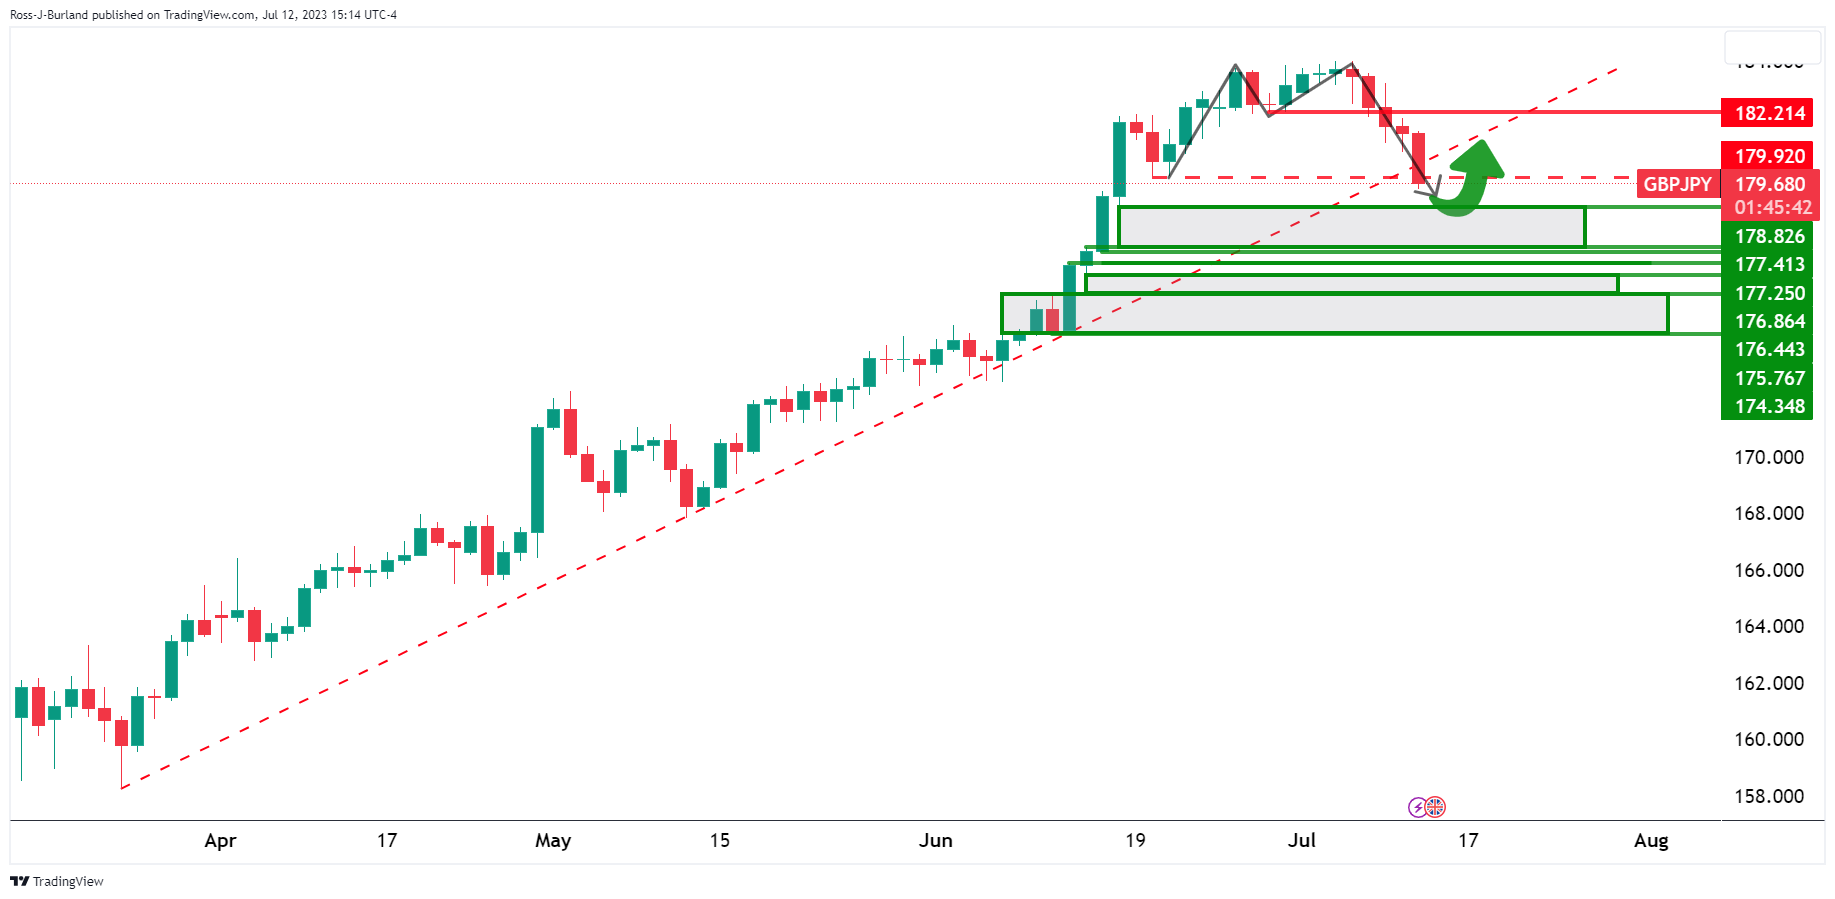
GBP/JPY is down some 0.9% and has fallen from a high of 181.51 to a low of 179.46 so far. The daily chart shows the price breaking the support structure near 179.90 which puts the emphasis on the downside, medium term, but potentially supports a meanwhile bullish bias into the bearish impulse. The M-formation is a reversion pattern that would be expected to draw in the price towards the neckline.
GBP/JPY daily chart
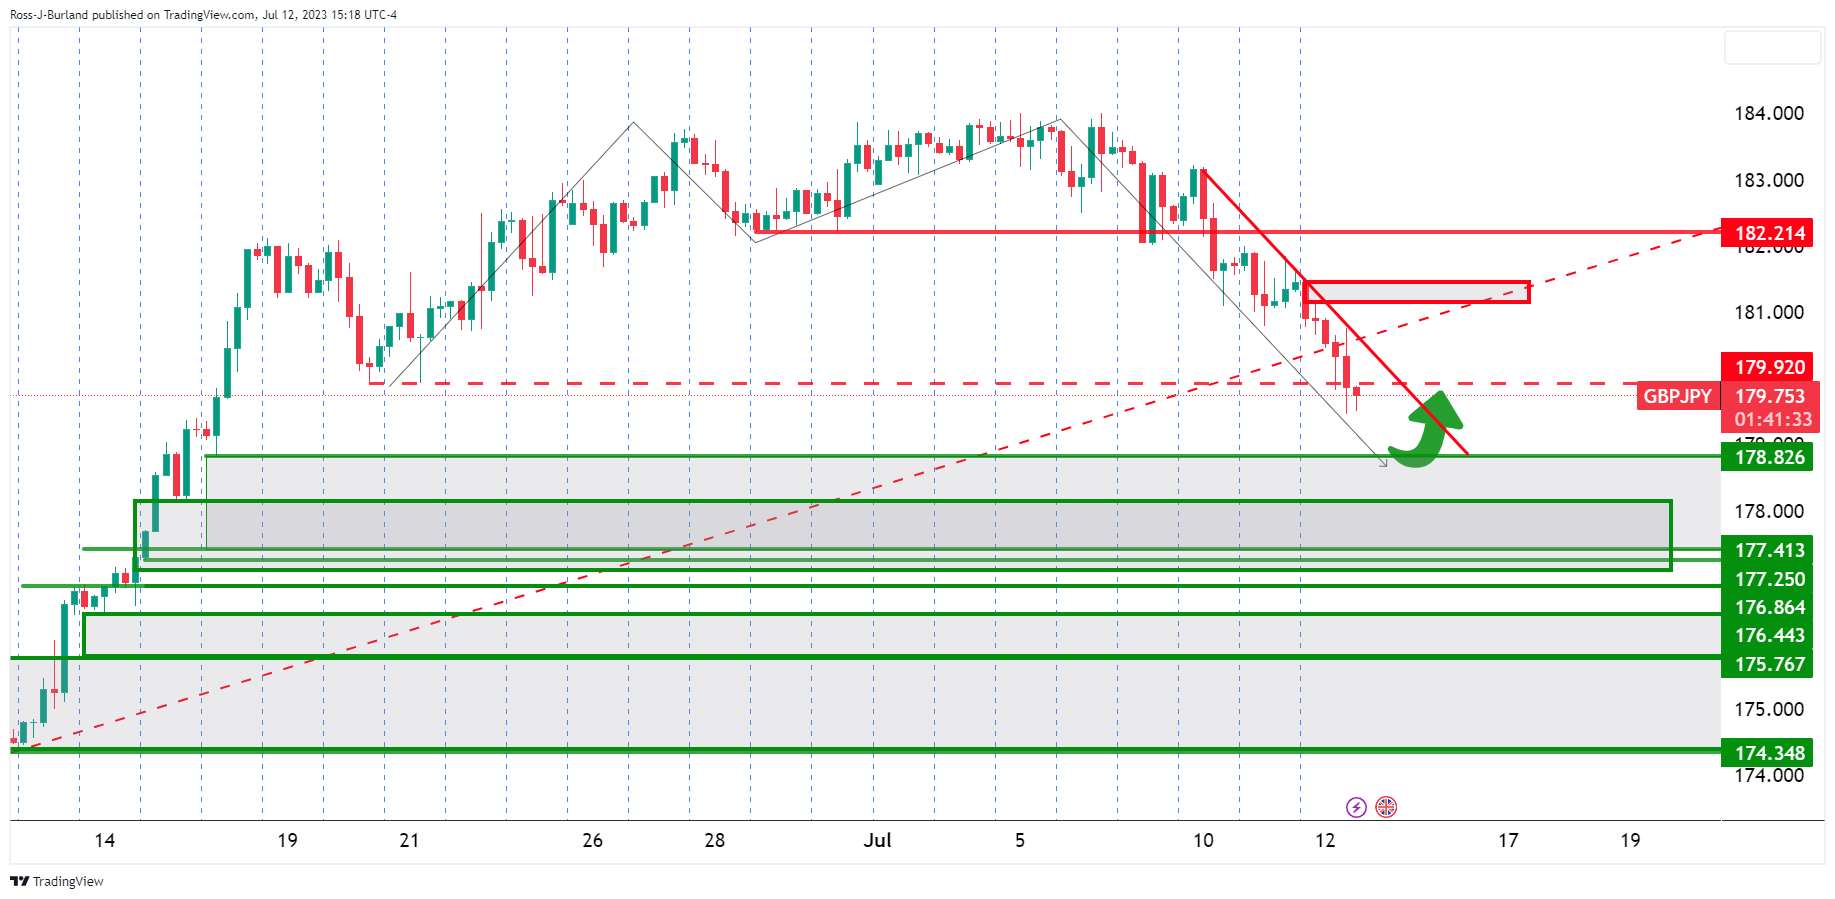
GBP/JPY H4 chart
GBP/JPY 4-hour chart shows a series of bearish closes with little signs of a deceleration in the offer, so far,
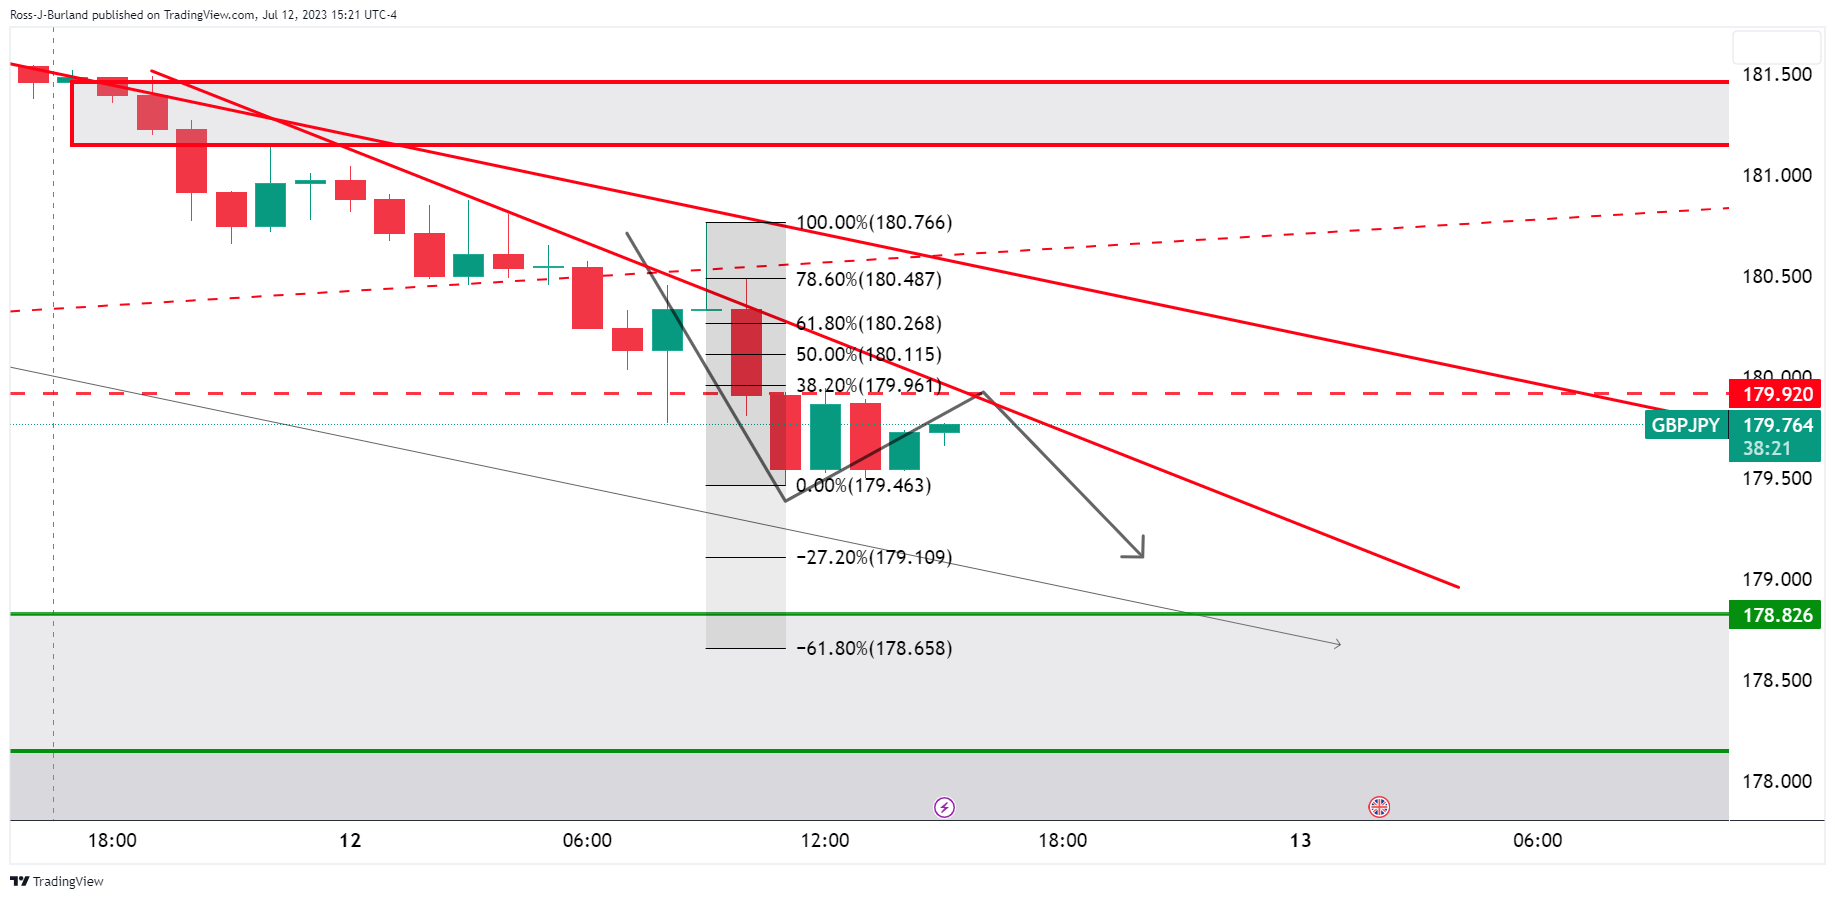
GBP/JPY H1 charts
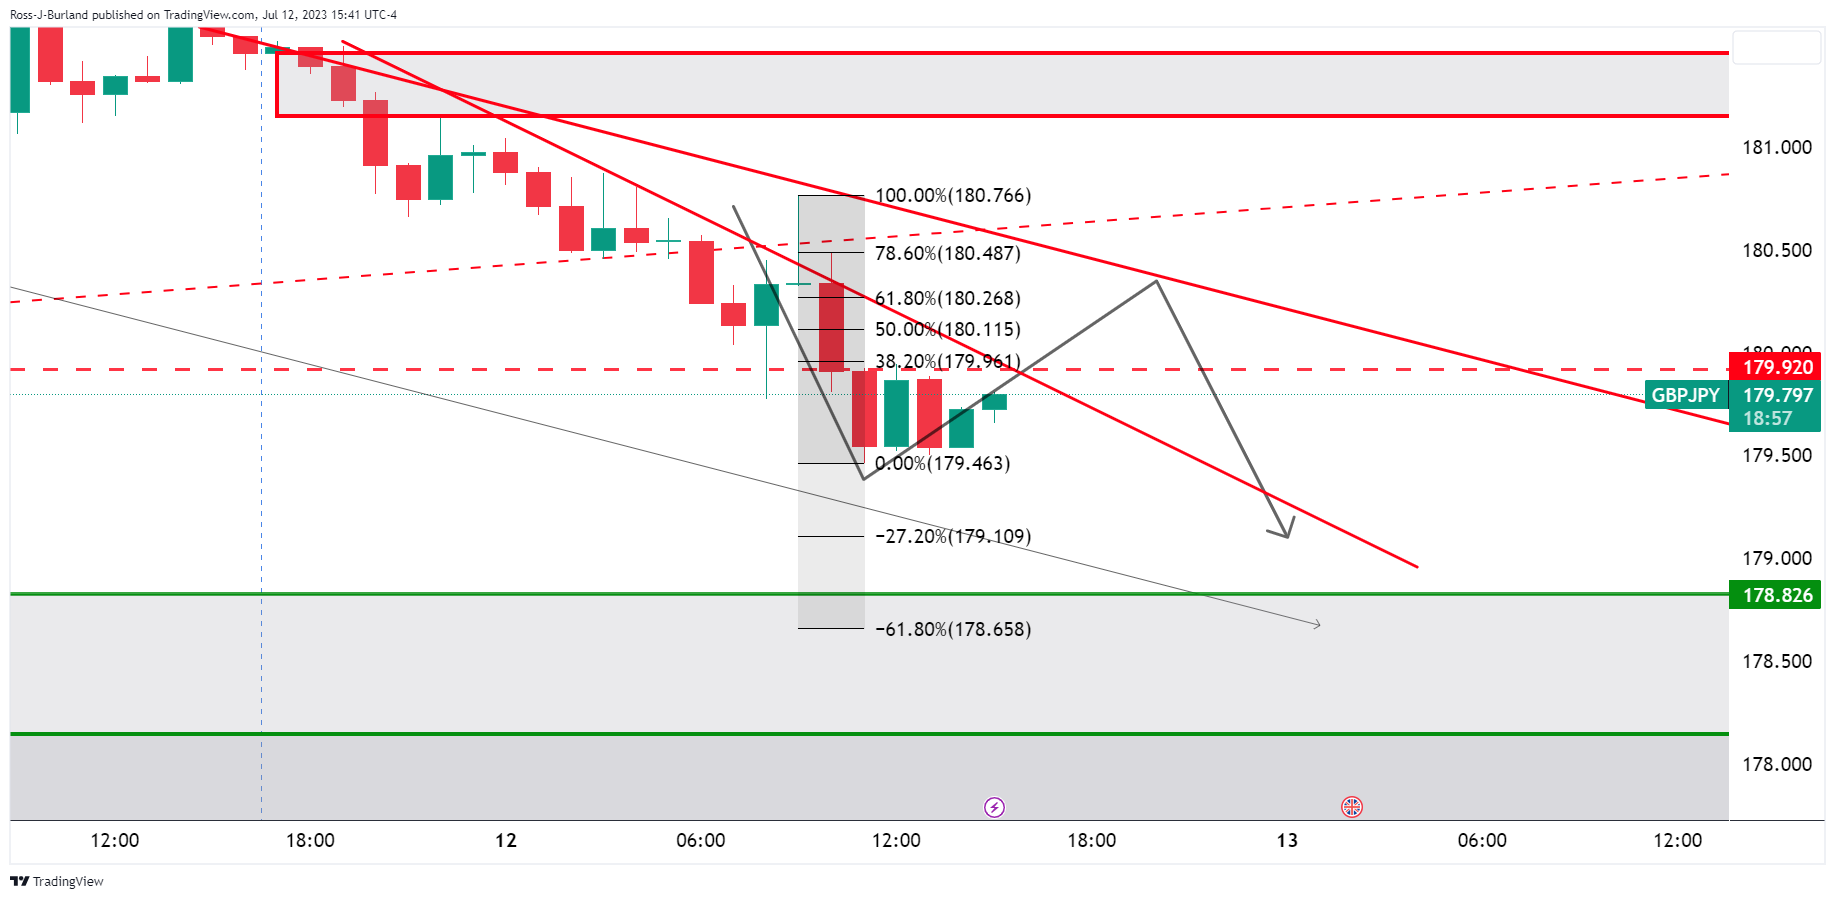
GBP/JPY hourly charts are showing that the price is decelerating on the offer and has moved into a 38.2% Fibonacci retracement of the prior hourly bearish impulse. We have two trendline resistances eyed with prospects of a move towards a 78.6% Fibonacci area near 180.50.
Meanwhile, a break of resistance opens risk to the neckline of the daily M-formation.
Information on these pages contains forward-looking statements that involve risks and uncertainties. Markets and instruments profiled on this page are for informational purposes only and should not in any way come across as a recommendation to buy or sell in these assets. You should do your own thorough research before making any investment decisions. FXStreet does not in any way guarantee that this information is free from mistakes, errors, or material misstatements. It also does not guarantee that this information is of a timely nature. Investing in Open Markets involves a great deal of risk, including the loss of all or a portion of your investment, as well as emotional distress. All risks, losses and costs associated with investing, including total loss of principal, are your responsibility. The views and opinions expressed in this article are those of the authors and do not necessarily reflect the official policy or position of FXStreet nor its advertisers. The author will not be held responsible for information that is found at the end of links posted on this page.
If not otherwise explicitly mentioned in the body of the article, at the time of writing, the author has no position in any stock mentioned in this article and no business relationship with any company mentioned. The author has not received compensation for writing this article, other than from FXStreet.
FXStreet and the author do not provide personalized recommendations. The author makes no representations as to the accuracy, completeness, or suitability of this information. FXStreet and the author will not be liable for any errors, omissions or any losses, injuries or damages arising from this information and its display or use. Errors and omissions excepted.
The author and FXStreet are not registered investment advisors and nothing in this article is intended to be investment advice.
Recommended content
Editors’ Picks

EUR/USD hovers around 1.0500 on softer US Dollar demand
EUR/USD gained modest upward traction and trades around 1.0500 in the American session on Thursday. In the absence of high-tier data releases, improving risk mood makes it difficult for the US Dollar (USD) to find demand and helps the pair push higher.
GBP/USD rebounds from daily lows, bullish potential limited
After falling toward 1.2600 on disappointing macroeconomic data releases from the UK, GBP/USD gathered modest strength and advanced beyond 1.2650. The US Dollar, however, is recovering the ground lost and aiming to close the week in the green.

Gold pierces $2,660, upside remains capped
Gold (XAU/USD) puts pressure on daily lows and trades below $2,660 on Friday’s early American session. The US Dollar (USD) reclaims its leadership ahead of the weekly close, helped by rising US Treasury yields.

Bitcoin and Ripple stalls while Ethereum eyes rally
Bitcoin faces resistance near $101,100, hinting at a potential downturn. At the same time, Ethereum eyes a rally if it can firmly close above $4,000, and Ripple holds support at $1.96, with a breakdown signaling a possible decline.

Can markets keep conquering record highs?
Equity markets are charging to new record highs, with the S&P 500 up 28% year-to-date and the NASDAQ Composite crossing the key 20,000 mark, up 34% this year. The rally is underpinned by a potent mix of drivers.

Best Forex Brokers with Low Spreads
VERIFIED Low spreads are crucial for reducing trading costs. Explore top Forex brokers offering competitive spreads and high leverage. Compare options for EUR/USD, GBP/USD, USD/JPY, and Gold.
