|

GBP/JPY Price Analysis: Rebounds from weekly lows, eyes 186.30s

  • GBP/JPY halts its bearish momentum, but downside risks remain if it fails to conquer the Tenkan-Sen.
  • A ‘tweezers-bottom’ candlestick chart pattern is forming; further upside expected?
  • Buyers failure to conquer 186.00, could exacerbate a drop toward the 184.50 area.

GBP/JPY snaps four days of losses, climbs 0.31% in the late Tuesday North American session, and exchanges hands at around 186.00 after bouncing from daily/weekly lows reached at 184.45.

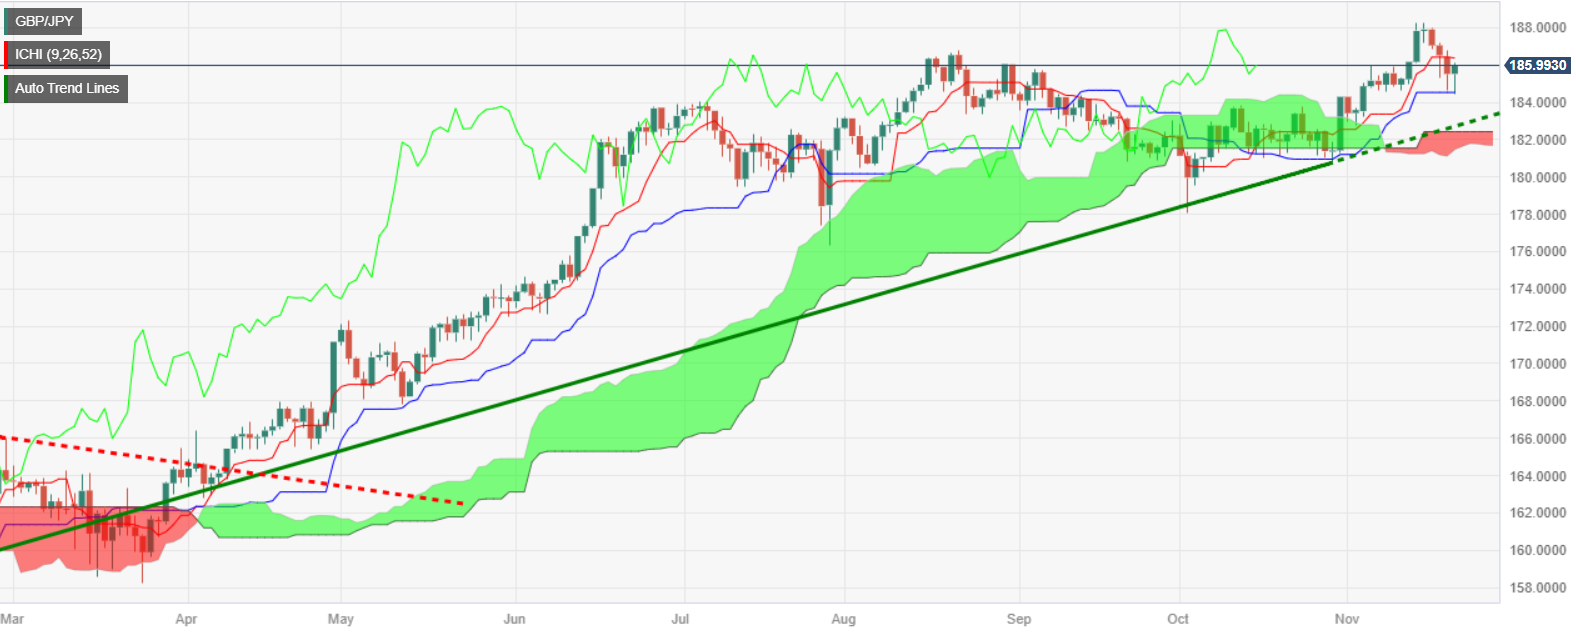
The GBP/JPY daily chart portrays the pair as neutral biased, as the slope of the Tenkan and Kijun-Sen shifted flat, which could open the door for range-bound trading. On the upside, the pair’s first resistance would be the Tenkan-Sen at 186.37, followed by the 187.00 figure, ahead of the year-to-date (YTD) high at 188.24.

On the other hand, if GBP/JPY drops below the Kijun-Sen at 184.52, that would pave the way to test the Senkou Span B at 183.15, followed by the bottom of the Ichimoku Cloud (Kumo) at 181.75.

GBP/JPY Price Analysis – Daily Chart

GBP/JPY Technical Levels

GBP/JPY

Overview
Today last price186.01
Today Daily Change0.49
Today Daily Change %0.26
Today daily open185.52
 
Trends
Daily SMA20184.62
Daily SMA50183.21
Daily SMA100183.17
Daily SMA200176.07
 
Levels
Previous Daily High186.79
Previous Daily Low184.63
Previous Weekly High188.29
Previous Weekly Low185
Previous Monthly High184.33
Previous Monthly Low178.08
Daily Fibonacci 38.2%185.46
Daily Fibonacci 61.8%185.97
Daily Pivot Point S1184.5
Daily Pivot Point S2183.48
Daily Pivot Point S3182.34
Daily Pivot Point R1186.66
Daily Pivot Point R2187.81
Daily Pivot Point R3188.83

Author

Christian Borjon Valencia

Markets analyst, news editor, and trading instructor with over 14 years of experience across FX, commodities, US equity indices, and global macro markets.

More from Christian Borjon Valencia
Share:

Editor's Picks

EUR/USD looks apathetic around 1.1770

EUR/USD comes under renewed pressure on Tuesday, deflating below the 1.1800 support and reversing two consecutive days of gains. The pair’s decline follows the persistent move higher in the US Dollar, as trade uncertainty dominates the sentiment ahead of President Trump’s SOTU speech.

GBP/USD regains 1.3500 and above

GBP/USD extends its advance for the third day in a row on Tuesday, this time retesting the area beyond the 1.3500 hurdle. Cable’s uptick comes despite decent gains in the Greenback and the dovish message from the BoE’s Bailey at the UK Parliament.

Gold appears offered around $5,150

Gold is giving back a good portion of the recent multi-day rally, receding to the $5,150 zone per troy ounce amid the decent bounce in the US Dollar and mixed US Treasuty yields. In the meantime, markets’ attention remain on upcoming comments from Fed speakers.

Ripple’s DeFi shift in focus: Navigating XRPL EVM sidechain growth, XRPFi migration and liquidity

Ripple (XRP) has continued to trade under pressure, extending its decline by approximately 63% from the record high of $3.66 in July. The remittance token is trading above support at $1.35, while its upside appears limited by key supply zones, starting with $1.40, at the time of writing on Tuesday.

The Citrini report: How a debatable AI narrative can shake Wall Street

That AI-related headline alone was enough to rattle investors.US stocks slid sharply on Monday after a widely circulated Citrini Research memo outlined a hypothetical “2028 Global Intelligence Crisis”, warning that rapid AI adoption could push US unemployment into double digits as early as by mid-2028.

XRP pressured by weak ETF flows and declining retail interest

Ripple (XRP) is edging lower, trading above its intraday low of $1.32 at the time of writing on Tuesday. The decline from its weekly opening of $1.39 reflects heightened volatility in the broader cryptocurrency market, accentuated by tariff-triggered uncertainty.