|

GBP/JPY Price Analysis: Oscillates around 166.11 amid a risk-off impulse

  • GBP/JPY erases some of its gains, set to finish the week with more than 3% gains.
  • GBP/JPY traders mainly ignored UK’s political turmoil.
  • The cross-currency is range-bound, as depicted by the one-hour chart.

The GBP/JPY trims some of its Thursday’s losses but remains nearby weekly highs at around the 166.00 area, despite UK’s political turmoil, weighing on the GBP/USD, the GBP/JPY continues to hold to gains due to the Bank of Japan dovish stance. Therefore, the GBP/JPY is trading at 166.16, below its opening price by 0.33%.

GBP/JPY Price Forecast

The GBP/JPY daily chart was unchanged compared to Thursday, though it should be noted that the exchange rate is above the October 5 high of 165.71, which could keep the GBP/JPY trading within the 165.71-167.27 range. Oscillators remain in positive territory, keeping the neutral-to-upward bias intact, though a break above 167.27 would pave the path to 167.94, ahead of challenging the YTD high at 168.73.

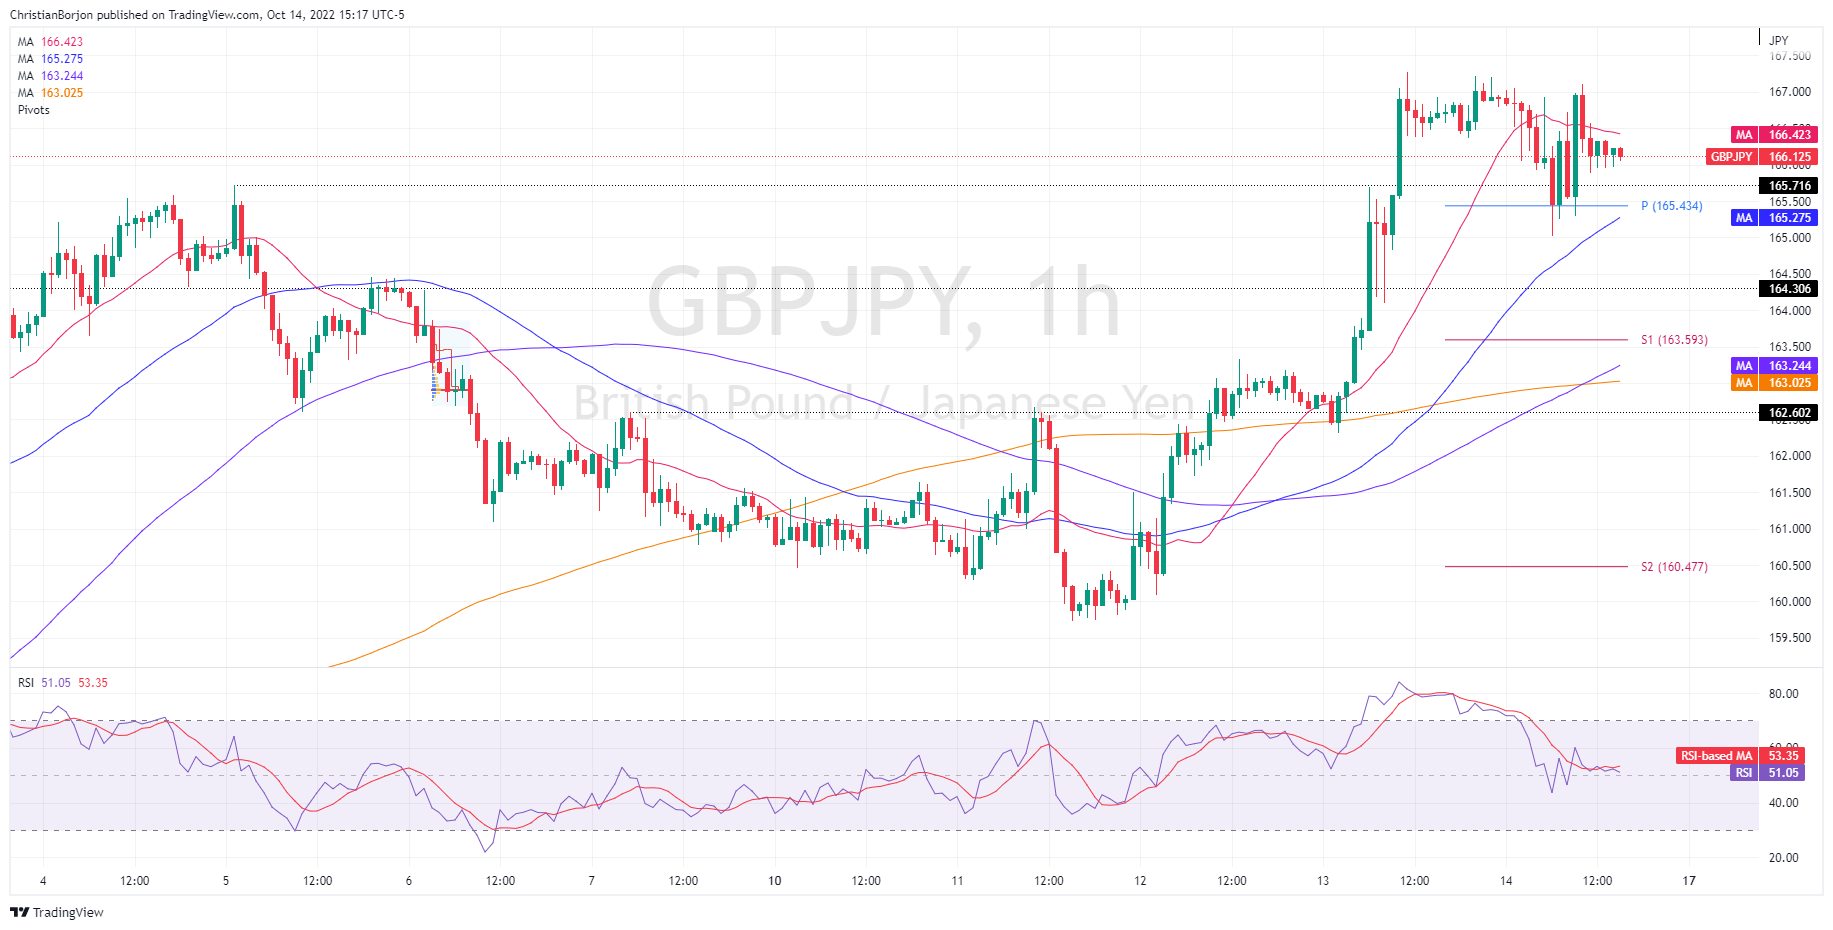
The GBP/JPY one-hour scale portrays the pair consolidating between the 20 and 50-EMAs, while the Relative Strength Index (RSI) is almost flat but at bullish territory. Upwards, the first resistance would be the 20-EMA at 166.42, followed by the daily high at 167.21, ahead of the 168.00 figure.

On the other hand, the GBP/JPY first support would be the daily pivot at 165.45, immediately followed by the 50-EMA at 165.27. Once that 18-pip area cleared, the GBP/JPY could tumble to the 165.00 area, followed by the S1 pivot at 163.59.

GBP/JPY Key Technical Levels

GBP/JPY

Overview
Today last price166.12
Today Daily Change-0.67
Today Daily Change %-0.40
Today daily open166.79
 
Trends
Daily SMA20161.24
Daily SMA50162.28
Daily SMA100163.24
Daily SMA200160.78
 
Levels
Previous Daily High167.29
Previous Daily Low162.33
Previous Weekly High165.72
Previous Weekly Low160.58
Previous Monthly High167.22
Previous Monthly Low148.8
Daily Fibonacci 38.2%165.4
Daily Fibonacci 61.8%164.22
Daily Pivot Point S1163.65
Daily Pivot Point S2160.5
Daily Pivot Point S3158.68
Daily Pivot Point R1168.61
Daily Pivot Point R2170.44
Daily Pivot Point R3173.58

Author

Christian Borjon Valencia

Markets analyst, news editor, and trading instructor with over 14 years of experience across FX, commodities, US equity indices, and global macro markets.

More from Christian Borjon Valencia
Share:

Editor's Picks

EUR/USD holds above 1.1750 after mixed PMI data

EUR/USD manages to hold above 1.1750 but struggles to gather recovery momentum on Friday, following the mixed February PMI figures from Germany and the Eurozone. In the second half of the day, Q4 GDP, December inflation and February PMI data from the US will be watched closely by market participants.

GBP/USD recovers above 1.3450 ahead of UK PMI data

GBP/USD is recovering ground above 1.3450 in European trading on Friday, helped by a modest uptick in the Pound Sterling after a bigger-than-expected increase in the UK Retail Sales for January. However, the further upside appears limited in the pair amid persistent US Dollar strength and ahead of key UK and US data. 

Gold rises for third day on geopolitical risks, US data eyed

Gold gains some positive traction for the third consecutive day on Friday. The upside potential, however, seems limited amid the mixed fundamental backdrop. Moreover, traders might opt to wait for the key US macro releases – the Advance Q4 GDP report and the Personal Consumption Expenditures (PCE) Price Index – before placing fresh directional bets.

US GDP growth expected to slow down significantly in Q4 after stellar Q3 

The United States Bureau of Economic Analysis will publish the first preliminary estimate of the fourth-quarter Gross Domestic Product at 13:30 GMT. Analysts forecast the US economy to have expanded at a 3% annualized rate, slowing down from the 4.4% growth posted in the previous quarter.

Iran tensions and AI fears at the forefront ahead of key US data

Thursday’s scorecard shows major US Stock benchmarks closed modestly in the red amid mounting US-Iran tensions and AI disruption worries. The S&P 500 shed 19 points (0.3%) to 6,861, the Nasdaq 100 lost 101 points (0.4%) to 24,797, and the Dow Jones Industrial Average dropped 267 points (0.5%) to 49,395.

Official Trump price approaches breakout with mixed signals from traders

Official Trump (TRUMP) is trading at $3.50 at the time of writing, approaching its upper consolidation range. A breakout from this range could open the door for an upside move. On-chain data shows market indecision, with balanced flows between bulls and bears, signaling a lack of clear directional bias.