GBP/JPY Price Analysis: On the way to 164.70 support confluence


  • GBP/JPY fades bounce off two-week low as it approaches the key support.
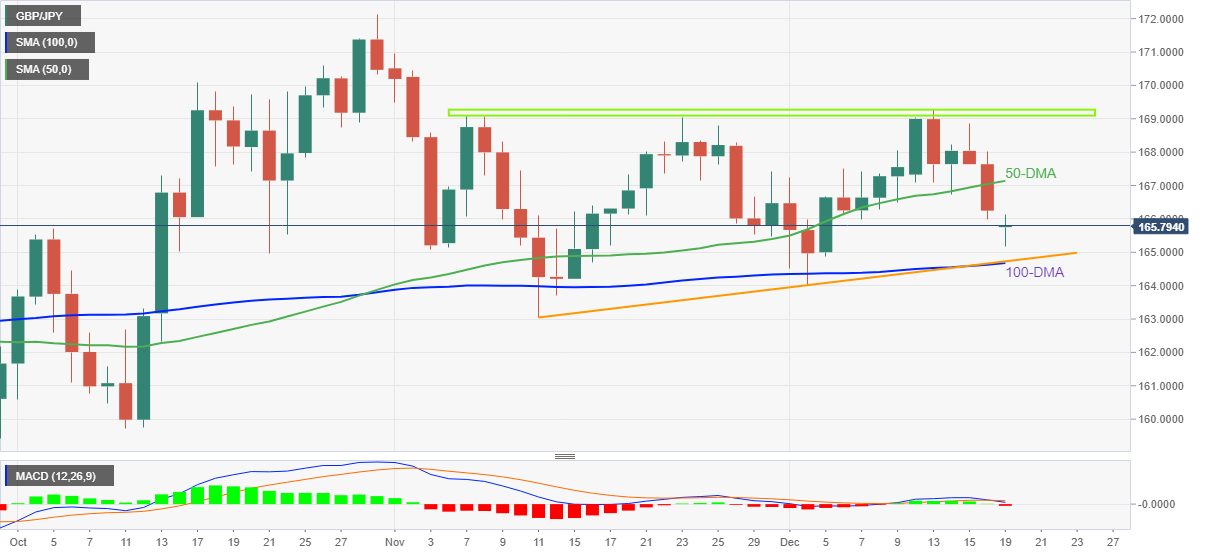
  • 100-DMA, five-week-old ascending support line restricts short-term downside.
  • Bearish MACD signals, clear break of 50-DMA favor sellers.

GBP/JPY bears keep the reins, fading the day-start bounce off 165.20, ahead of Monday’s London open.

That said, the cross-currency pair’s daily closing below the 50-DMA joins the bearish MACD signals to favor GBP/JPY bears. However, a convergence of the 100-DMA and an upward-sloping trend line from November 11, near 164.70, appears a tough nut to crack for the bears.

In a case where the prices drop below 164.70, November’s low near 163.00 could act as an extra filter towards the south before highlighting the 160.00 psychological magnet.

It should be noted, however, that October’s low near 159.75 could challenge the GBP/JPY bears afterward.

Alternatively, recovery moves appear elusive unless the quote provides a daily closing beyond the 50-DMA level of 167.15.

In that case, a five-week-old horizontal resistance area near 169.00-169.20 will act as the key hurdle to the upside. Also acting as an extra filter is the 170.00 round figure.

Overall, GBP/JPY remains on the back foot as it breaks key support and has MACD as a backup to call the bears. However, the downside moves appear to have limited room unless providing a daily closing below 164.70.

GBP/JPY: Daily chart

Trend: Further downside expected

Additional important levels

Overview
Today last price 165.77
Today Daily Change -0.48
Today Daily Change % -0.29%
Today daily open 166.25
 
Trends
Daily SMA20 167.1
Daily SMA50 167.04
Daily SMA100 164.63
Daily SMA200 163.61
 
Levels
Previous Daily High 168.01
Previous Daily Low 165.99
Previous Weekly High 169.28
Previous Weekly Low 165.99
Previous Monthly High 170.95
Previous Monthly Low 163.06
Daily Fibonacci 38.2% 166.76
Daily Fibonacci 61.8% 167.24
Daily Pivot Point S1 165.49
Daily Pivot Point S2 164.73
Daily Pivot Point S3 163.47
Daily Pivot Point R1 167.51
Daily Pivot Point R2 168.77
Daily Pivot Point R3 169.53


Share: Feed news

Information on these pages contains forward-looking statements that involve risks and uncertainties. Markets and instruments profiled on this page are for informational purposes only and should not in any way come across as a recommendation to buy or sell in these assets. You should do your own thorough research before making any investment decisions. FXStreet does not in any way guarantee that this information is free from mistakes, errors, or material misstatements. It also does not guarantee that this information is of a timely nature. Investing in Open Markets involves a great deal of risk, including the loss of all or a portion of your investment, as well as emotional distress. All risks, losses and costs associated with investing, including total loss of principal, are your responsibility. The views and opinions expressed in this article are those of the authors and do not necessarily reflect the official policy or position of FXStreet nor its advertisers. The author will not be held responsible for information that is found at the end of links posted on this page.

If not otherwise explicitly mentioned in the body of the article, at the time of writing, the author has no position in any stock mentioned in this article and no business relationship with any company mentioned. The author has not received compensation for writing this article, other than from FXStreet.

FXStreet and the author do not provide personalized recommendations. The author makes no representations as to the accuracy, completeness, or suitability of this information. FXStreet and the author will not be liable for any errors, omissions or any losses, injuries or damages arising from this information and its display or use. Errors and omissions excepted.

The author and FXStreet are not registered investment advisors and nothing in this article is intended to be investment advice.

Recommended content


Recommended content

Editors’ Picks

EUR/USD retreats to 1.0700 area following post-PCE jump

EUR/USD retreats to 1.0700 area following post-PCE jump

After spiking to a daily high of 1.0720 with the immediate reaction to US PCE inflation data, EUR/USD lost its traction and declined to the 1.0700 area. Investors remain cautious ahead of this weekend's French election and make it difficult for the Euro to gather strength.

EUR/USD News

GBP/USD stays below 1.2650 after US inflation data

GBP/USD stays below 1.2650 after US inflation data

GBP/USD struggles to preserve its bullish momentum and trades below 1.2650 in the American session on Friday. Earlier in the day, the data from the US showed that the annual core PCE inflation declined to 2.6% in May, limiting the USD's upside and helping the pair hold its ground.

GBP/USD News

Gold keeps its daily gains near $2,330 following US PCE data

Gold keeps its daily gains near $2,330 following US PCE data

Gold prices maintain their constructive bias around $2,330 after US inflation readings gauged by the PCE matched consensus in May and US yields advance slightly across the curve.

Gold News

BTC struggles around the $62,000 level

BTC struggles around the $62,000 level

Bitcoin price faces pullback resistance at the lower band of the descending wedge around $62,000. Ethereum price finds support at $3,288, the 61.8% Fibonacci retracement level. Ripple price faces resistance at $0.500, its daily resistance level.

Read more

French Elections Preview: Euro to suffer after the calm, as specter of extremists, uncertainty rise Premium

French Elections Preview: Euro to suffer after the calm, as specter of extremists, uncertainty rise

The first round of French parliamentary elections is set to trigger high uncertainty. Soothing messages from the far right and far left leave the Euro vulnerable to falls. Calm may return only after the second round of voting on  July 7.

Read more

Forex MAJORS

Cryptocurrencies

Signatures