- GBP/JPY remains under selling pressure near 182.65 after the UK's weaker-than-expected data.
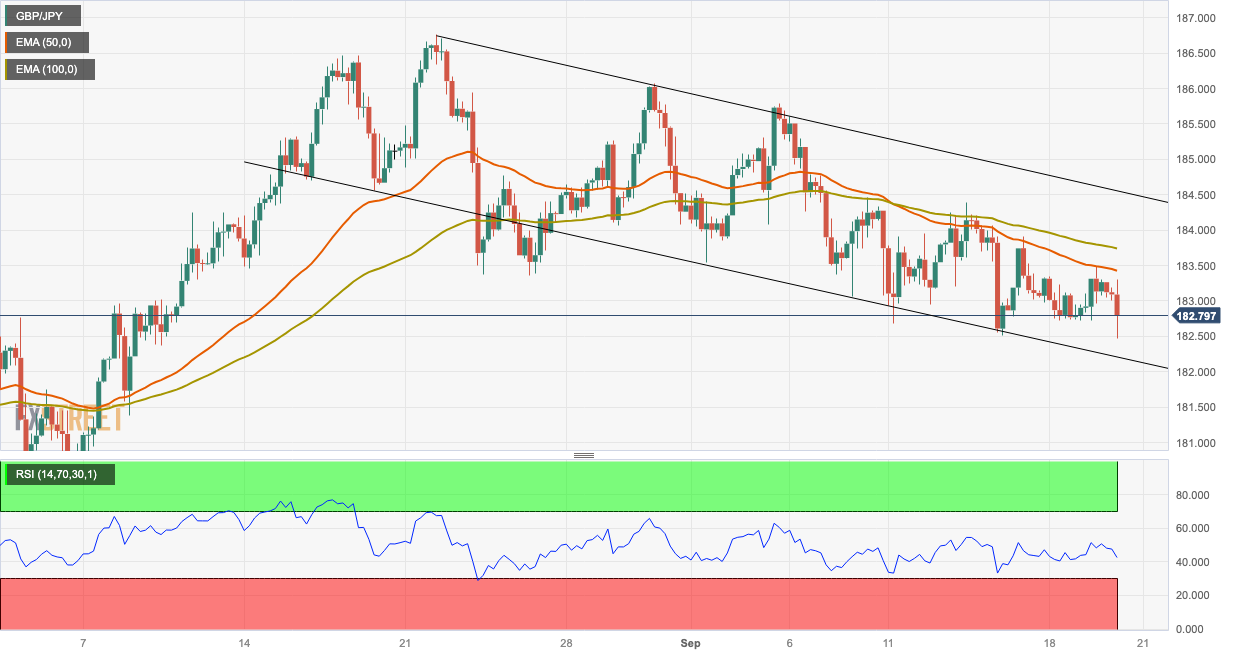
- The cross holds below the 50- and 100-hour EMAs with a downward slope on the four-hour chart.
- The immediate resistance level is seen at 183.00; 182.20 acts as an initial support level.
The GBP/JPY cross loses momentum during the early European session on Wednesday. The British Pound (GBP) faces some selling pressure following the softer-than-expected economic data from the UK. The market mood remains cautious as investors await the Bank of England (BoE) interest rate decision on Thursday. The cross currently trades near 182.65, losing 0.31% on the day.
The latest data from the UK's Office for National Statistics reported on Wednesday revealed that the nation’s Consumer Price Index (CPI) dropped to 6.7% YoY in August from 6.8% in the previous reading, below the market consensus of 7.1%. In the same period, the Core CPI, which excludes volatile food and energy prices, fell to 6.2% from 6.9% in the previous month. Additionally, the Retail Price Index climbed 9.1% YoY in August, compared to expectations of 9.3%. In response to the data, GBP/JPY dropped more than 50 pips to below the 183.00 mark.
From the technical perspective, the GBP/JPY cross trades within the descending trend-channel since the middle of August. The cross holds below the 50- and 100-hour Exponential Moving Averages (EMAs) with a downward slope on the four-hour chart, highlighting the path of least resistance for the cross is to the downside.
The first resistance level of GBP/JPY is seen at a psycholocal mark of 183.00, followed by 183.42 (the 50-hour EMA). The additional upside filter to watch is 183.75 (the 100-hour EMA). Further north, the next stop is located near the upper boundary of the descending trend-channel at 184.55. Any meaningful follow-through buying will see the next stop at 185.25 (a high of August 29)/
On the downside, a decisive break below the lower limit of the descending trend-channel at 182.20 will see a drop to a psychological round figure at 182.00 en route to 181.38 (a low of August 8) and finally at 180.90 (a low of July 30).
Furthermore, the Relative Strength Index (RSI) is located in bearish territory below 50, highlighting that further downside cannot be ruled out.
GBP/JPY four-hour chart
Information on these pages contains forward-looking statements that involve risks and uncertainties. Markets and instruments profiled on this page are for informational purposes only and should not in any way come across as a recommendation to buy or sell in these assets. You should do your own thorough research before making any investment decisions. FXStreet does not in any way guarantee that this information is free from mistakes, errors, or material misstatements. It also does not guarantee that this information is of a timely nature. Investing in Open Markets involves a great deal of risk, including the loss of all or a portion of your investment, as well as emotional distress. All risks, losses and costs associated with investing, including total loss of principal, are your responsibility. The views and opinions expressed in this article are those of the authors and do not necessarily reflect the official policy or position of FXStreet nor its advertisers. The author will not be held responsible for information that is found at the end of links posted on this page.
If not otherwise explicitly mentioned in the body of the article, at the time of writing, the author has no position in any stock mentioned in this article and no business relationship with any company mentioned. The author has not received compensation for writing this article, other than from FXStreet.
FXStreet and the author do not provide personalized recommendations. The author makes no representations as to the accuracy, completeness, or suitability of this information. FXStreet and the author will not be liable for any errors, omissions or any losses, injuries or damages arising from this information and its display or use. Errors and omissions excepted.
The author and FXStreet are not registered investment advisors and nothing in this article is intended to be investment advice.


Recommended content
Editors’ Picks

AUD/USD: Extra advances look likely
AUD/USD briefly advanced to new yearly peaks near 0.6450, although it gave away all that move later in the day along with the firm performance of the US Dollar on the back of diminishing US-China trade jitters. All the attention now shifts to Australian inflation gauges due on Wednesday.

EUR/USD: Weekly gains look capped above 1.1400
EUR/USD failed to build on Monday’s gains and slipped back below the 1.1400 region on the back of the resumption of the upside impulse in the Greenback. Market participants, in the meantime, remained cautious ahead of key US data releases later in the week.

Gold bounces off lows near $3,300
After bottoming out near the $3,300 region per troy ounce, Gold prices approach the $3,330 zone as the US Dollar gives away part of its daily advance and the risk-on mood gathers extra pace.

Crypto market cruises near an important mark
The crypto market cap has risen by 7.5% over the past seven days, stabilising just below the $3 trillion mark.

May flashlight for the FOMC blackout period – Waiting for the fog to lift
We expect the FOMC will leave its target range for the federal funds rate unchanged at 4.25-4.50% at its upcoming meeting on May 6-7, a view widely shared by financial markets and economists. Market pricing currently implies only a 9% probability of the FOMC cutting the fed funds rate by 25 bps.

The Best brokers to trade EUR/USD
SPONSORED Discover the top brokers for trading EUR/USD in 2025. Our list features brokers with competitive spreads, fast execution, and powerful platforms. Whether you're a beginner or an expert, find the right partner to navigate the dynamic Forex market.