|

GBP/JPY Price Analysis: Hits eight-year high on risk appetite improvement, bull's eye 190.00

  • GBP/JPY uptrend appears to be overextended, with the next major target set at the 190.00 psychological level, a peak not seen since September 2008.
  • A successful breach of 190.00 could open the path towards the September 2008 high of 198.34, potentially even the 200.00 mark.
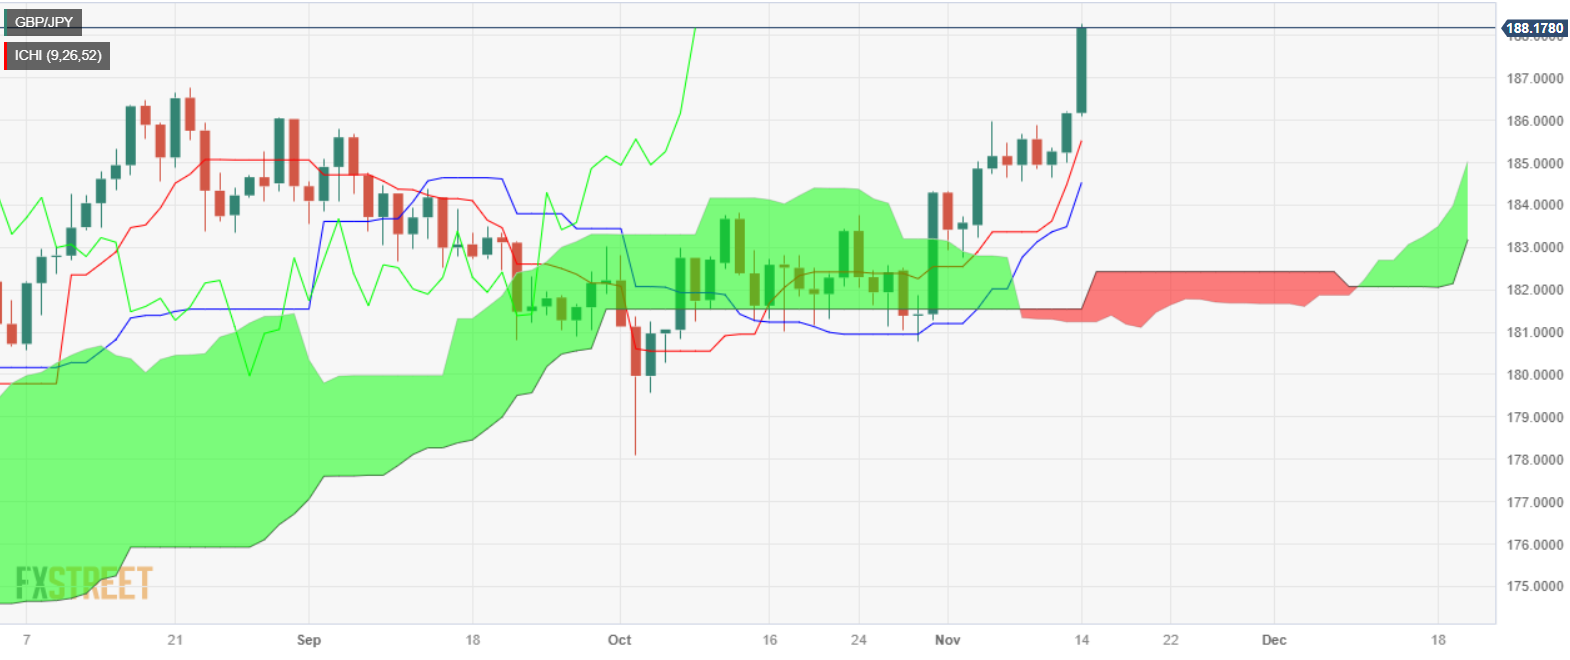
  • On the downside, initial support is today’s low of 186.04, followed by the Tenkan-Sen at 185.50, the Kijun-Sen at 184.52, and the Senkou-Span A at 185.01.

In the mid-North American session, GBP/JPY rallied and refreshed eight-year highs at around 188.28 on Tuesday, after economic data from the US sparked speculations the Federal Reserve wouldn’t tighten monetary policy any further. Investors see that as a green light to buy riskier assets, to the detriment of the safe-haven status of the Japanese Yen (JPY). The GBP/JPY trades at 188.08, up more than 2%

 Given the abovementioned fundamental intro, from a technical perspective, the GBP/JPY uptrend seems overextended, with buyers targeting the 190.00 mark, a level that hasn’t been reached since September 2008. A breach of the latter will immediately expose the September 2008 high at 198.34 ahead of testing 200.00.

On the other hand, the GBP/JPY first support is seen at today’s low of 186.04, which, once cleared, te pair could dive to the Tenkan-Sen level at 185.50, followed by the Kijun-Sen at 184.52. Once cleared, the next support would be the Senkou-Span A at 185.01.

GBP/JPY Price Analysis – Daily Chart

GBP/JPY Technical Levels

GBP/JPY

Overview
Today last price188.03
Today Daily Change1.86
Today Daily Change %1.00
Today daily open186.17
 
Trends
Daily SMA20183.49
Daily SMA50182.95
Daily SMA100182.98
Daily SMA200175.37
 
Levels
Previous Daily High186.21
Previous Daily Low185
Previous Weekly High185.97
Previous Weekly Low184.55
Previous Monthly High184.33
Previous Monthly Low178.08
Daily Fibonacci 38.2%185.75
Daily Fibonacci 61.8%185.46
Daily Pivot Point S1185.37
Daily Pivot Point S2184.58
Daily Pivot Point S3184.16
Daily Pivot Point R1186.59
Daily Pivot Point R2187.01
Daily Pivot Point R3187.8

Author

Christian Borjon Valencia

Markets analyst, news editor, and trading instructor with over 14 years of experience across FX, commodities, US equity indices, and global macro markets.

More from Christian Borjon Valencia
Share:

Editor's Picks

EUR/USD seems fragile below 1.1700 as Middle East war boosts energy prices

The EUR/USD pair trades flat at around 1.1680 during the Asian trading session on Tuesday, but broadly seems vulnerable, being close to its five-week low. The major currency pair is under pressure as surging oil prices due to the United States-Israel war with Iran have increased the risks of higher inflation for the Old Continent.

GBP/USD hovers around 1.3400 with bearish pressure intact

GBP/USD edges higher after three days of losses, trading around 1.3400 during the Asian hours on Tuesday. The technical analysis of the daily chart indicates an ongoing bearish bias, as the pair trades within a descending channel pattern.

Gold sticks to gains above $5,350 amid sustained safe-haven demand; firmer USD caps gains

Gold sticks to its positive bias for the third straight day and trades above the $5,350 level heading into the European session on Tuesday. Concerns about a broader regional conflict in the Middle East continue to weigh on investors' sentiment and underpin demand for the traditional safe-haven bullion.

Stellar risks deeper losses as derivatives metrics turn negative

Stellar is trading red below $0.16 at the time of writing on Tuesday, after a slight recovery the previous day. Weakening derivatives data caps the recovery, while an unfavorable technical outlook projects a deeper correction for the XLM token in the upcoming days.

The market is not panicking it is repricing the probability distribution of Oil and time

At the end of the day, markets do not trade morality or geopolitics. They trade transmission channels. And the only channel that truly matters in this maelstrom runs through the price of energy and the time value of money.

Grass 20% bullish breakout defies broader market weakness

Grass (GRASS) is edging up above $0.30 at the time of writing on Monday. The token’s notable 20% intraday surge stands out amid heightened volatility in the broader crypto market.