- GBP/JPY drops below a three-month-old upslope trendline, down since last week’s high close of around 3%.
- The RSI at oversold conditions suggests the GBP/JPY could be bottoming, but the RoC suggests that sellers remain in charge.
- GBP/JPY Price Analysis: Break below 157.00 would exacerbate a fall to 154.00.
The GBP/JPY plunged more than 100 pips on Monday, extending its losses to three consecutive days, once price action dived below the 200-day Exponential Moving Average (EMA). Furthermore, the cross of the 20-day EMA beneath the 200-day EMA exacerbated the acceleration of the downtrend, as the GBP/JPY gets poised to fall toward the 155.00 mark. At the time of writing, the GBP/JPY is trading at 157.46, below its opening price by 0.69%.
GBP/JPY Price Analysis: Technical outlook
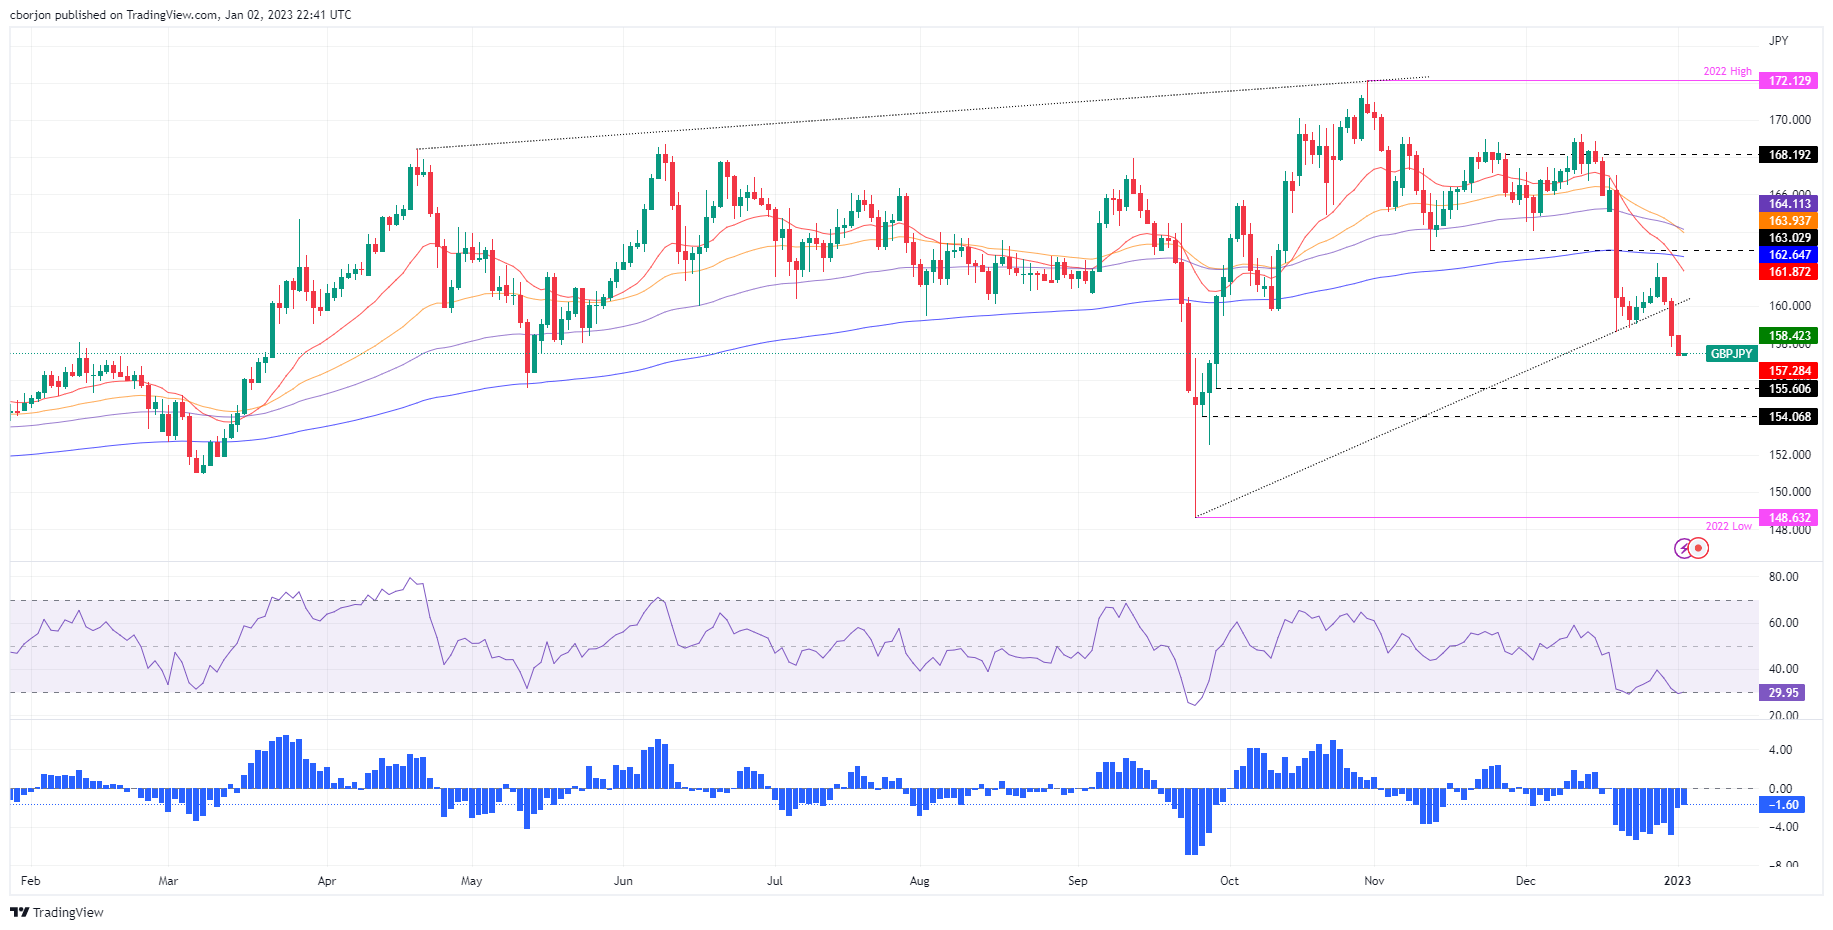
After clearing a three-month-old upslope support trendline drawn from September lows around 148.60s, the GBP/JPY fall increased its velocity. Last Thursday, the GBP/JPY formed a bearish engulfing candle pattern, followed by a tall red candle that cleared on its way south of the 160.00 figure and the previously mentioned trendline. Oscillators like the Relative Strength Index (RSI) entered oversold conditions, while the Rate of Change (RoC) shows that sellers remain gathering momentum. Therefore, the GBP/JPY might continue to fall further.
Therefore the GBP/JPY first support would be the September 29 daily low of 155.60, followed by the 155.00 mark, ahead of the September 27 swing low of 154.07.
As an alternate scenario, if GBP/JPY buyers reclaim 159.00, that could open the door to 160.00, close of the previously mentioned upslope trendline, which would be resistance, ahead of the 20-day EMA at 161.86.
GBP/JPY Key Technical Levels
Information on these pages contains forward-looking statements that involve risks and uncertainties. Markets and instruments profiled on this page are for informational purposes only and should not in any way come across as a recommendation to buy or sell in these assets. You should do your own thorough research before making any investment decisions. FXStreet does not in any way guarantee that this information is free from mistakes, errors, or material misstatements. It also does not guarantee that this information is of a timely nature. Investing in Open Markets involves a great deal of risk, including the loss of all or a portion of your investment, as well as emotional distress. All risks, losses and costs associated with investing, including total loss of principal, are your responsibility. The views and opinions expressed in this article are those of the authors and do not necessarily reflect the official policy or position of FXStreet nor its advertisers. The author will not be held responsible for information that is found at the end of links posted on this page.
If not otherwise explicitly mentioned in the body of the article, at the time of writing, the author has no position in any stock mentioned in this article and no business relationship with any company mentioned. The author has not received compensation for writing this article, other than from FXStreet.
FXStreet and the author do not provide personalized recommendations. The author makes no representations as to the accuracy, completeness, or suitability of this information. FXStreet and the author will not be liable for any errors, omissions or any losses, injuries or damages arising from this information and its display or use. Errors and omissions excepted.
The author and FXStreet are not registered investment advisors and nothing in this article is intended to be investment advice.
Recommended content
Editors’ Picks

EUR/USD nears 1.1200 after US PCE inflation data
EUR/USD approaches 1.1200 following generally softer-than-anticipated US inflation-related figures. The pair lacks momentum amid tepid European data undermining demand for the Euro. Still, optimism weighs on the USD.

GBP/USD battles the 1.3400 level for a definitive bullish breakout
GBP/USD advances modestly beyond the 1.3400 level after US PCE inflation data showed price pressures continued to recede in August. Sterling Pound aims for fresh yearly highs beyond the 1.3433 peak posted earlier this week.

Gold hovers around $2,670 as US Dollar resumes decline
Gold price retains its bullish bias near fresh record highs, as demand for the US Dollar remains subdued following US PCE inflation figures. The strong momentum around stocks limits demand for the safe-haven metal.

Week ahead – NFP on tap amid bets of another bold Fed rate cut
Investors see decent chance of another 50bps cut in November. Fed speakers, ISM PMIs and NFP to shape rate cut bets. Eurozone CPI data awaited amid bets for more ECB cuts. China PMIs and BoJ Summary of Opinions also on tap.

RBA widely expected to keep key interest rate unchanged amid persisting price pressures
The Reserve Bank of Australia is likely to continue bucking the trend adopted by major central banks of the dovish policy pivot, opting to maintain the policy for the seventh consecutive meeting on Tuesday.

Five best Forex brokers in 2024
VERIFIED Choosing the best Forex broker in 2024 requires careful consideration of certain essential factors. With the wide array of options available, it is crucial to find a broker that aligns with your trading style, experience level, and financial goals.