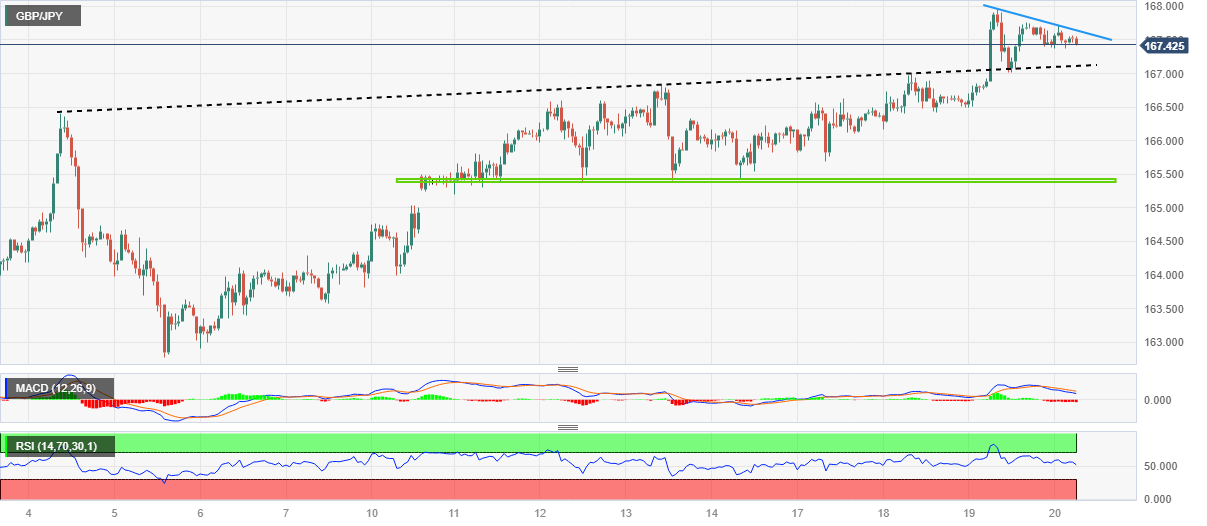
- GBP/JPY retreats from four-month high, prints the first daily loss in five.
- Failures to stay beyond 168.00 joins bearish MACD signals to lure GBP/JPY bears.
- Resistance-turned-support from early April, steady RSI prods pair sellers.
- Upside break of the immediate trend line hurdle could aim for the late 2022 peak.
GBP/JPY prints mild losses around 167.50 heading into Thursday’s London open. In doing so, the cross-currency pair consolidates the four-day uptrend at the highest levels since late 2022.
That said, the bearish MACD signals join the quote’s repeated failure to stay beyond the 168.00 round figure to lure the GBP/JPY pair sellers.
However, the steady RSI (14) line and a 12-day-old descending trend line, previous resistance around 167.00, restrict the immediate downside of the quote.
Following that, multiple lows marked during mid-April, near 164.50-40, will be in the spotlight.
It should be noted that a one-week-old horizontal area of around 165.40-50 could offer an intermediate halt to the GBP/JPY pair sellers between 167.00 and 164.40.
On the flip side, a downward-sloping trend line stretched from the previous day’s peak, around 167.65 at the latest, could quickly portray the pair’s other attempt to surpass the 168.00 figure.
Also acting as a short-term key upside hurdle is the late 2022 peak of 169.27 and the 170.00 round figure, a break of which could highlight the November 2022 high of nearly 172.15.
GBP/JPY: Hourly chart
Trend: Pullback expected
Information on these pages contains forward-looking statements that involve risks and uncertainties. Markets and instruments profiled on this page are for informational purposes only and should not in any way come across as a recommendation to buy or sell in these assets. You should do your own thorough research before making any investment decisions. FXStreet does not in any way guarantee that this information is free from mistakes, errors, or material misstatements. It also does not guarantee that this information is of a timely nature. Investing in Open Markets involves a great deal of risk, including the loss of all or a portion of your investment, as well as emotional distress. All risks, losses and costs associated with investing, including total loss of principal, are your responsibility. The views and opinions expressed in this article are those of the authors and do not necessarily reflect the official policy or position of FXStreet nor its advertisers. The author will not be held responsible for information that is found at the end of links posted on this page.
If not otherwise explicitly mentioned in the body of the article, at the time of writing, the author has no position in any stock mentioned in this article and no business relationship with any company mentioned. The author has not received compensation for writing this article, other than from FXStreet.
FXStreet and the author do not provide personalized recommendations. The author makes no representations as to the accuracy, completeness, or suitability of this information. FXStreet and the author will not be liable for any errors, omissions or any losses, injuries or damages arising from this information and its display or use. Errors and omissions excepted.
The author and FXStreet are not registered investment advisors and nothing in this article is intended to be investment advice.
Recommended content
Editors’ Picks

EUR/USD on the defensive around 1.0400 after upbeat US data
EUR/USD is under mild selling pressure around the 1.0400 mark following the release of upbeat United States data. Q3 GDP was upwardly revised to 3.1% from 2.8% previously, while weekly unemployment claims improved to 220K in the week ending December 13.

GBP/USD struggles around 1.2600 after BoE rate decision
GBP/USD retreated from its daily peak and battles around 1.2600 following the Bank of England monetary policy decision. The BoE kept the benchmark interest rate unchanged at 4.75% as expected, but the accompanying statement leaned to dovish. Three out of nine MPC members opted for a cut.

Gold price resumes slide, pierces the $2,600 level
Gold resumes its decline after the early advance and trades below $2,600 early in the American session. Stronger than anticipated US data and recent central banks' outcomes fuel demand for the US Dollar. XAU/USD nears its weekly low at $2,582.93.

Bitcoin slightly recovers after sharp sell-off following Fed rate cut decision
Bitcoin (BTC) recovers slightly, trading around $102,000 on Thursday after dropping 5.5% the previous day. Whales, corporations, and institutional investors saw an opportunity to take advantage of the recent dips and added more BTC to their holdings.

Bank of England stays on hold, but a dovish front is building
Bank of England rates were maintained at 4.75% today, in line with expectations. However, the 6-3 vote split sent a moderately dovish signal to markets, prompting some dovish repricing and a weaker pound. We remain more dovish than market pricing for 2025.

Best Forex Brokers with Low Spreads
VERIFIED Low spreads are crucial for reducing trading costs. Explore top Forex brokers offering competitive spreads and high leverage. Compare options for EUR/USD, GBP/USD, USD/JPY, and Gold.
