|

GBP/JPY Price Analysis: Drops to new weekly low below 200.00

  • GBP/JPY slips to 199.68 after hitting YTD high of 200.74 on May 29.
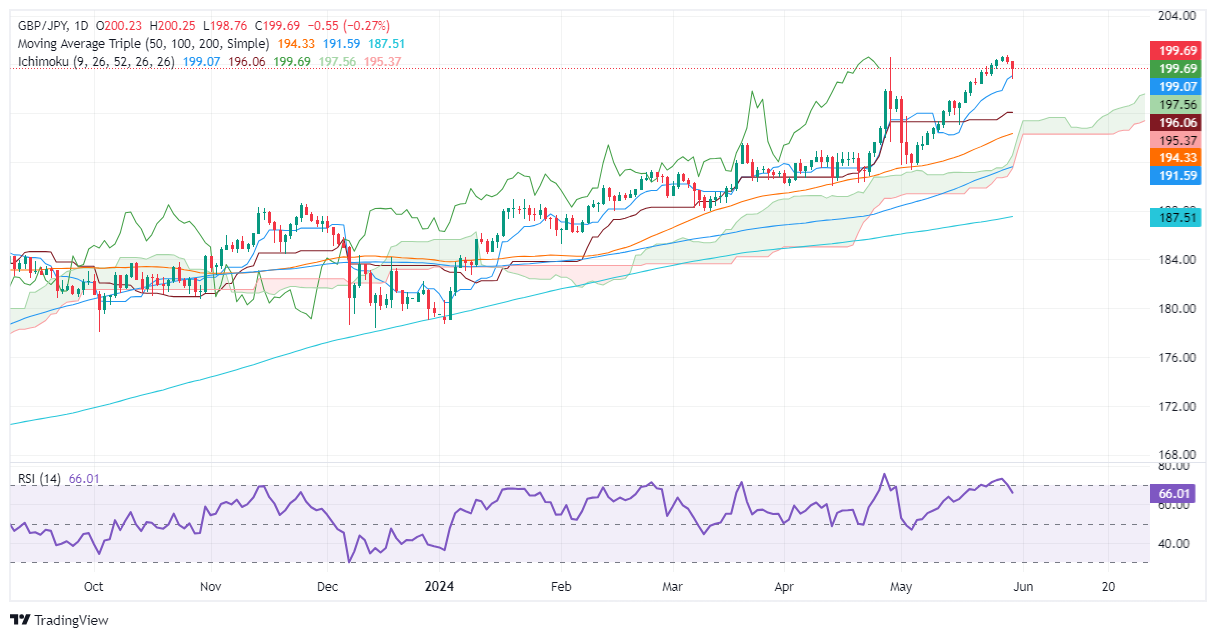
  • Technical indicators show momentum fading, with RSI exiting overbought conditions.
  • Key support levels: Kijun-Sen at 199.03, Senkou Span A at 197.54, and Tenkan-Sen at 196.05.

The GBP/JPY extended its losses for the second straight day after the cross-pair retreated from around the year-to-date (YTD) high of 200.74, hit on May 29. At the time of writing, the pair trades at 199.68, posting modest losses of 0.24%.

GBP/JPY Price Analysis: Technical outlook

The GBP/JPY uptrend remains intact after buyers achieved fourteen positive trading sessions, opening the door to new yearly highs. Despite that, momentum seems to be fading as the Relative Strength Index (RSI) exited from overbought conditions, opening the door for a mean reversion move. Therefore, the cross registered back-to-back negative sessions, dragging the exchange rate below 200.00.

If GBP/JPY drops below the Kijun-Sen of 199.03, that would sponsor a dip to the Senkou Span A at 197.54. Further losses lie below 197.00, kike the Tenkan-Sen at 196.05.

On the other hand, if buyers reclaim 200.00, look for renewed buying that can push the exchange rate to challenge the YTD high of 200.74.

GBP/JPY Price Action – Daily Chart

GBP/JPY

Overview
Today last price199.7
Today Daily Change-0.53
Today Daily Change %-0.26
Today daily open200.23
 
Trends
Daily SMA20196.84
Daily SMA50194.18
Daily SMA100191.45
Daily SMA200187.43
 
Levels
Previous Daily High200.75
Previous Daily Low200.05
Previous Weekly High200.07
Previous Weekly Low197.39
Previous Monthly High200.59
Previous Monthly Low190
Daily Fibonacci 38.2%200.32
Daily Fibonacci 61.8%200.48
Daily Pivot Point S1199.94
Daily Pivot Point S2199.64
Daily Pivot Point S3199.24
Daily Pivot Point R1200.64
Daily Pivot Point R2201.04
Daily Pivot Point R3201.34

Author

Christian Borjon Valencia

Markets analyst, news editor, and trading instructor with over 14 years of experience across FX, commodities, US equity indices, and global macro markets.

More from Christian Borjon Valencia
Share:

Editor's Picks

EUR/USD holds above 1.1750 after mixed EU PMI data

EUR/USD manages to hold above 1.1750 but struggles to gather recovery momentum on Friday, following the mixed February PMI figures from Germany and the Eurozone. In the second half of the day, Q4 GDP, December inflation and February PMI data from the US will be watched closely by market participants.

GBP/USD recovers further toward 1.3500 after UK PMI data

GBP/USD is recovering ground further toward 1.3500 in European trading on Friday, helped by a modest uptick in the Pound Sterling after stronger-than-expected UK January Retail Sales and February PMI data. However, the pair's further upside could be limited amid persistent US Dollar strength as the focus turns to key US data. 

Gold sticks to positive bias above $5,000 ahead of US data

Gold gains some positive traction for the third consecutive day on Friday. holding above $5,000. Traders now look forward to the key US macro releases – the Advance Q4 GDP report and the Personal Consumption Expenditures (PCE) Price Index – for fresh trading impetus. 

US GDP growth expected to slow down significantly in Q4 after stellar Q3 

The United States Bureau of Economic Analysis will publish the first preliminary estimate of the fourth-quarter Gross Domestic Product at 13:30 GMT. Analysts forecast the US economy to have expanded at a 3% annualized rate, slowing down from the 4.4% growth posted in the previous quarter.

Iran tensions and AI fears at the forefront ahead of key US data

Thursday’s scorecard shows major US Stock benchmarks closed modestly in the red amid mounting US-Iran tensions and AI disruption worries. The S&P 500 shed 19 points (0.3%) to 6,861, the Nasdaq 100 lost 101 points (0.4%) to 24,797, and the Dow Jones Industrial Average dropped 267 points (0.5%) to 49,395.

Official Trump price approaches breakout with mixed signals from traders

Official Trump (TRUMP) is trading at $3.50 at the time of writing, approaching its upper consolidation range. A breakout from this range could open the door for an upside move. On-chain data shows market indecision, with balanced flows between bulls and bears, signaling a lack of clear directional bias.