|

GBP/JPY Price Analysis: Drops on safe-haven flows, back below 161.00

  • GBP/JPY extends its losses, from around 163.00 to 160.60 in the last four days.
  • Risk aversion in the FX space underpins safe-haven peers.
  • GBP/JPY: To resume its downward bias below 160.34; otherwise, a test of 162.07 is on the cards.

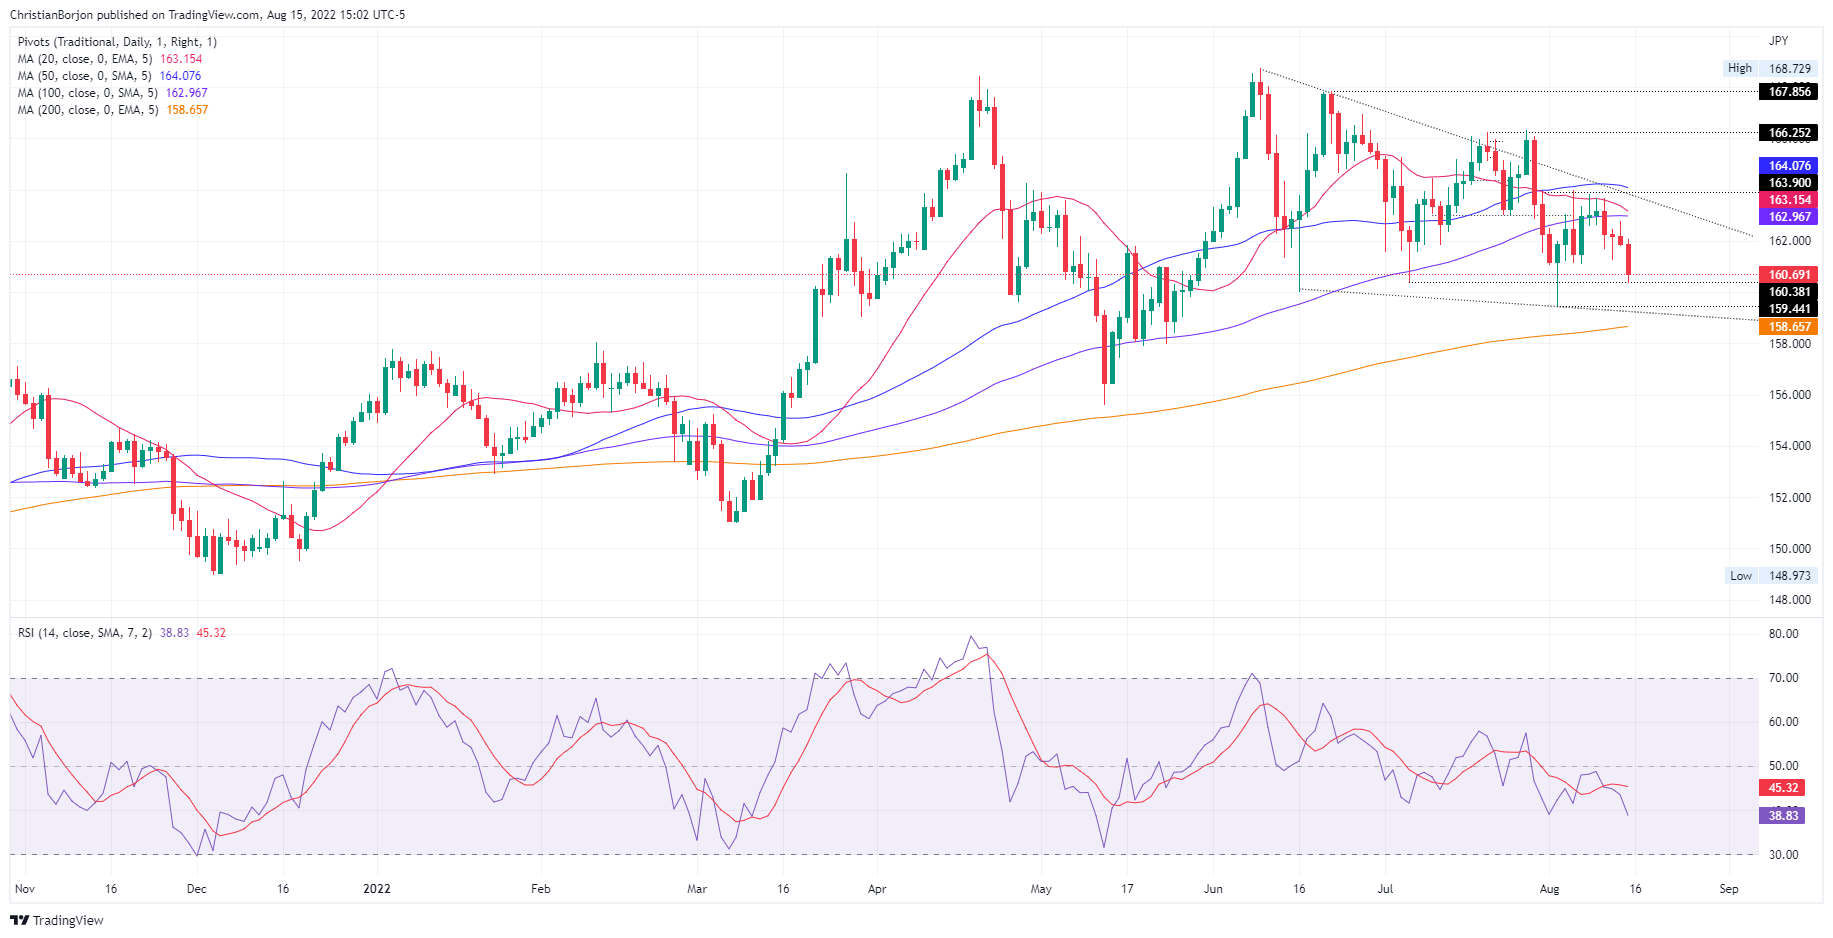
The GBP/JPY stumbles and refreshes two-week lows, eyeing a break below the July 6 low at 160.38, which could exacerbate a move towards the August 2 low at 159.44, ahead of the 200-day EMA at 158.65. At the time of writing, the GBP/JPY is trading at 160.69, down 0.75, due to a risk-off impulse in the FX space, to the detriment of risk-sensitive currencies, namely the GBP, AUD, and NZD.

GBP/JPY Price Analysis: Technical outlook

The longer-term of the GBP/JPY is neutral-to-downward biased as shown by the daily chart. Succesive series of lower highs/lows, alongside the Relative Strength Index (RSI) aiming downwards and below its 7-day RSI SMA, exacerbated the cross fall in the last four days. Also, the 20-day EMA is about to cross under the 100-day EMAat 162.97, which would exert additional selling pressure on the pair. That could send the GBP/JPY towards the 200-day EMA at 158.65.

Therefore, the GBP/JPY’s first support would be the August 15 low at 160.34. Break below will expose the July 6 low at 160.38, followed by the August 2 low at 159.44, followed by the abovementioned 200-day EMA.

On the flip side, the GBP/JPY's first resistance would be the August 15 high at 162.07. Once cleared, the next resistance will be August 12, high at 162.79, followed by the 163.00 figure.

GBP/JPY Daily chart

GBP/JPY Key Technical Levels

GBP/JPY

Overview
Today last price160.69
Today Daily Change-1.22
Today Daily Change %-0.75
Today daily open161.98
 
Trends
Daily SMA20163.44
Daily SMA50164.24
Daily SMA100163.05
Daily SMA200158.68
 
Levels
Previous Daily High162.8
Previous Daily Low161.81
Previous Weekly High163.85
Previous Weekly Low161.27
Previous Monthly High166.34
Previous Monthly Low160.4
Daily Fibonacci 38.2%162.19
Daily Fibonacci 61.8%162.42
Daily Pivot Point S1161.59
Daily Pivot Point S2161.21
Daily Pivot Point S3160.6
Daily Pivot Point R1162.59
Daily Pivot Point R2163.19
Daily Pivot Point R3163.58

Author

Christian Borjon Valencia

Markets analyst, news editor, and trading instructor with over 14 years of experience across FX, commodities, US equity indices, and global macro markets.

More from Christian Borjon Valencia
Share:

Editor's Picks

EUR/USD holds firm above 1.1900 as US NFP looms

EUR/USD holds its upbeat momentum above 1.1900 in the European trading hours on Wednesday, helped by a broadly weaker US Dollar. Markets could turn cautious later in the day as the delayed US employment report for January will takes center stage. 

GBP/USD remains above nine-day EMA near 1.3650

GBP/USD recovers its recent losses from the previous session, trading around 1.3680 during the European hours on Wednesday. The technical analysis of the daily chart indicates a sustained bullish bias, as the pair trades within an ascending channel pattern.

Gold sticks to gains near $5,050 as focus shifts to US NFP

Gold holds moderate gains near the $5,050 level in the European session on Wednesday, reversing a part of the previous day's modest losses amid dovish US Federal Reserve-inspired US Dollar weakness. This, in turn, is seen as a key factor acting as a tailwind for the non-yielding yellow metal ahead of the critical US NFP release. 

US Nonfarm Payrolls expected to show modest job gains in January

The United States Bureau of Labor Statistics will release the delayed Nonfarm Payrolls data for January on Wednesday at 13:30 GMT. Investors expect NFP to rise by 70K following the 50K increase recorded in December.

S&P 500 at 7,000 is a valuation test, not a liquidity problem

The rebound from last week’s drawdown never quite shook the sense that it was being supported by borrowed conviction. The S&P 500 once again tested near the 7,000 level (6,986 as the high watermark) and failed, despite a macro backdrop that would normally be interpreted as supportive of risk.

Bitcoin price slips below $67,000 ahead of US Nonfarm Payrolls data

Bitcoin price extends losses, and trades below the lower consolidating boundary at $67,300 at the time of writing. A firm close below this level could trigger a deeper correction for BTC. Despite the weakness in price action, institutional demand shows signs of support, recording mild inflows in ETFs so far this week.