- GBP/JPY struggles to break the 184.00 mark amid potential Japanese FX intervention, ending Tuesday with near flatline movement.
- Negative divergence in RSI suggests a potential for a pullback, with the Tenkan-Sen line inching closer to price action.
- Key levels to watch include resistance at 186.34 and several support levels leading down to the Kijun-Sen line at 178.21.
GBP/JPY consolidates at around the 183.60s area after hitting a year-to-date (YTD) high of 183.90, shy of hitting the 184.00 mark. On Tuesday, the GBP/JPY finished the session around 183.59, nearby its open price, forming a doji. That said, GBP/JPY is set to trade sideways unless a catalyst spurs a break to eigh-year highs or a correction gets underway. As the Asian session commences, the GBP/JPY trades at 153.65, almost flat.
GBP/JPY Price Analysis: Technical outlook
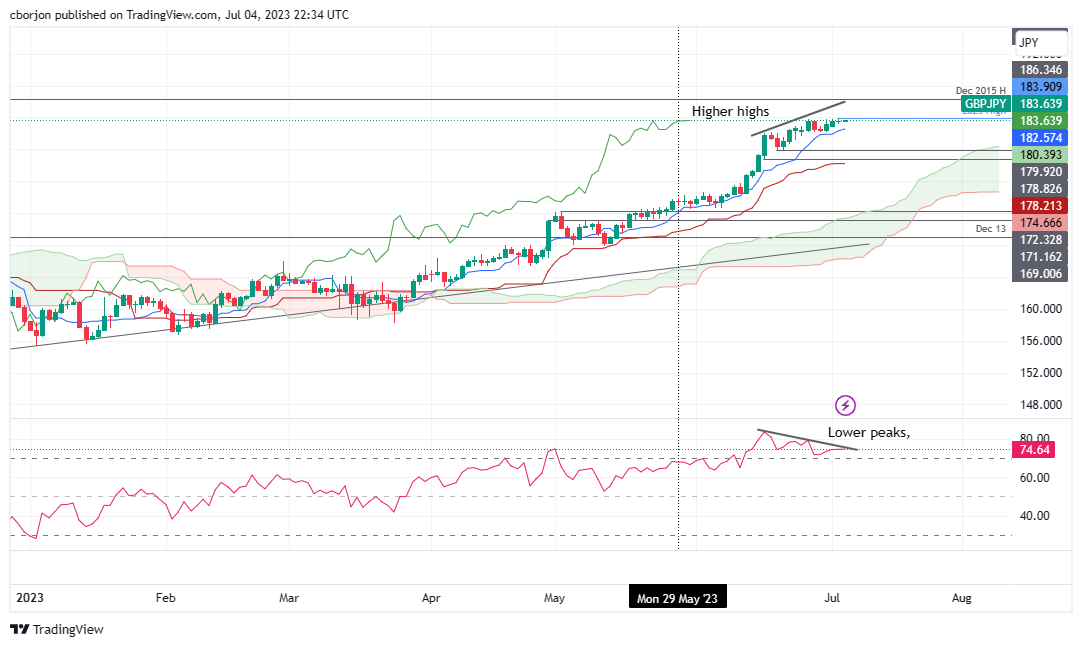
The GBP/JPY remains upward biased, though of late, the pair has struggled to get to new YTD highs, as threats of Japan’s government intervention in the FX markets keep traders on their toes. The Relative Strength Index (RSI) indicator remains at overbought levels, printing lower peaks, while the GBP/JPY registers higher highs. That means a negative divergence surfaced, which could pave the way for a pullback.
Additionally, the Tenkan-Sen line is getting close to price action, opening the door for a fall below the latte, which could spur a GBP/JPY sell signal, opening the door for a pullback toward the Senkou Span A line at 180.39 before slumping toward the June 20 daily low of 179.92. Break below will expose a test of the June 16 low of 178.82, slightly above the Kijun-Sen line at 178.21.
Conversely, if the GBP/JPY cracks the 184.00 mark, the first resistance appears at December’s 2015 high of 186.34, followed by the 190.00 figure.
GBP/JPY Price Action – Daily chart
Information on these pages contains forward-looking statements that involve risks and uncertainties. Markets and instruments profiled on this page are for informational purposes only and should not in any way come across as a recommendation to buy or sell in these assets. You should do your own thorough research before making any investment decisions. FXStreet does not in any way guarantee that this information is free from mistakes, errors, or material misstatements. It also does not guarantee that this information is of a timely nature. Investing in Open Markets involves a great deal of risk, including the loss of all or a portion of your investment, as well as emotional distress. All risks, losses and costs associated with investing, including total loss of principal, are your responsibility. The views and opinions expressed in this article are those of the authors and do not necessarily reflect the official policy or position of FXStreet nor its advertisers. The author will not be held responsible for information that is found at the end of links posted on this page.
If not otherwise explicitly mentioned in the body of the article, at the time of writing, the author has no position in any stock mentioned in this article and no business relationship with any company mentioned. The author has not received compensation for writing this article, other than from FXStreet.
FXStreet and the author do not provide personalized recommendations. The author makes no representations as to the accuracy, completeness, or suitability of this information. FXStreet and the author will not be liable for any errors, omissions or any losses, injuries or damages arising from this information and its display or use. Errors and omissions excepted.
The author and FXStreet are not registered investment advisors and nothing in this article is intended to be investment advice.
Recommended content
Editors’ Picks

EUR/USD treads water just above 1.0400 post-US data
Another sign of the good health of the US economy came in response to firm flash US Manufacturing and Services PMIs, which in turn reinforced further the already strong performance of the US Dollar, relegating EUR/USD to the 1.0400 neighbourhood on Friday.

GBP/USD remains depressed near 1.2520 on stronger Dollar
Poor results from the UK docket kept the British pound on the back foot on Thursday, hovering around the low-1.2500s in a context of generalized weakness in the risk-linked galaxy vs. another outstanding day in the Greenback.

Gold keeps the bid bias unchanged near $2,700
Persistent safe haven demand continues to prop up the march north in Gold prices so far on Friday, hitting new two-week tops past the key $2,700 mark per troy ounce despite extra strength in the Greenback and mixed US yields.

Geopolitics back on the radar
Rising tensions between Russia and Ukraine caused renewed unease in the markets this week. Putin signed an amendment to Russian nuclear doctrine, which allows Russia to use nuclear weapons for retaliating against strikes carried out with conventional weapons.

Eurozone PMI sounds the alarm about growth once more
The composite PMI dropped from 50 to 48.1, once more stressing growth concerns for the eurozone. Hard data has actually come in better than expected recently – so ahead of the December meeting, the ECB has to figure out whether this is the PMI crying wolf or whether it should take this signal seriously. We think it’s the latter.

Best Forex Brokers with Low Spreads
VERIFIED Low spreads are crucial for reducing trading costs. Explore top Forex brokers offering competitive spreads and high leverage. Compare options for EUR/USD, GBP/USD, USD/JPY, and Gold.