GBP/JPY Price Analysis: Bulls persist and propelled pair to fresh cycle, overbought signals arise


  • GBP/JPY extends its rally, hitting fresh cycle highs of around 202.50 on Monday.
  • Daily RSI and MACD stand near overbought territory.
  • Trend remains bullish but overbought conditions suggest potential corrections.

During Monday's session, the GBP/JPY pair sustained its uptrend, hitting new cycle highs around 202.50, reaching its highest point since 2007. Despite sellers making strides earlier in the session, bringing the pair down to a low of 106.14, buyers managed to counteract and propel the pair back to fresh cycle highs.

The Daily Relative Strength Index (RSI) currently sits at 68, settling slightly below the overbought territory. The upsurge recorded in last Friday’s readings hints at remaining bullish momentum, though the swift approach to overbought conditions may suggest a potential incoming correction. The Daily Moving Average Convergence Divergence (MACD) continues to display rising green bars, implying that the bullish momentum is still in the play, albeit approaching a crest.

GBP/JPY daily chart

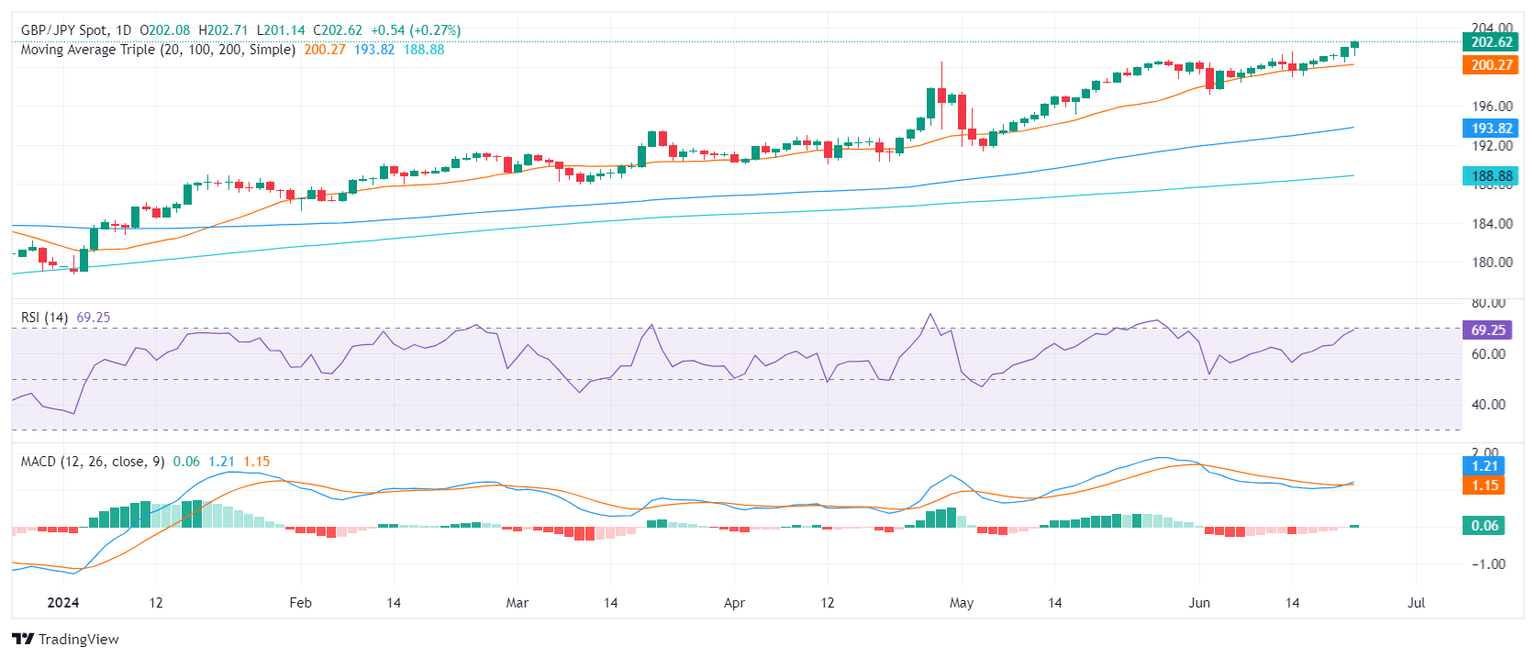
In summary, the GBP/JPY pair's solid performance on Monday underpins a broader bullish trend. The trend's positive outlook is validated by the pair's position above the 20-day, 100-day, and 200-day Simple Moving Averages (SMAs). However, as current indicators suggest over-extended movements, traders might brace for a likely correction event.

If the pair falls below the immediate support level set at 202.00, followed by the 201.00 and 202.20 levels (20-day SMA), it would likely seek new support thresholds at around the 200.00 psychological area. Conversely, resistance is seen near the psychological mark of 203.00 and further at 203.50, in case the bulls persist.


GBP/JPY

Overview
Today last price 202.6
Today Daily Change 0.52
Today Daily Change % 0.26
Today daily open 202.08
 
Trends
Daily SMA20 200.16
Daily SMA50 197.13
Daily SMA100 193.66
Daily SMA200 188.78
 
Levels
Previous Daily High 202.09
Previous Daily Low 200.48
Previous Weekly High 202.09
Previous Weekly Low 199.06
Previous Monthly High 200.75
Previous Monthly Low 191.37
Daily Fibonacci 38.2% 201.47
Daily Fibonacci 61.8% 201.09
Daily Pivot Point S1 201.01
Daily Pivot Point S2 199.94
Daily Pivot Point S3 199.4
Daily Pivot Point R1 202.62
Daily Pivot Point R2 203.16
Daily Pivot Point R3 204.23


Share: Feed news

Information on these pages contains forward-looking statements that involve risks and uncertainties. Markets and instruments profiled on this page are for informational purposes only and should not in any way come across as a recommendation to buy or sell in these assets. You should do your own thorough research before making any investment decisions. FXStreet does not in any way guarantee that this information is free from mistakes, errors, or material misstatements. It also does not guarantee that this information is of a timely nature. Investing in Open Markets involves a great deal of risk, including the loss of all or a portion of your investment, as well as emotional distress. All risks, losses and costs associated with investing, including total loss of principal, are your responsibility. The views and opinions expressed in this article are those of the authors and do not necessarily reflect the official policy or position of FXStreet nor its advertisers. The author will not be held responsible for information that is found at the end of links posted on this page.

If not otherwise explicitly mentioned in the body of the article, at the time of writing, the author has no position in any stock mentioned in this article and no business relationship with any company mentioned. The author has not received compensation for writing this article, other than from FXStreet.

FXStreet and the author do not provide personalized recommendations. The author makes no representations as to the accuracy, completeness, or suitability of this information. FXStreet and the author will not be liable for any errors, omissions or any losses, injuries or damages arising from this information and its display or use. Errors and omissions excepted.

The author and FXStreet are not registered investment advisors and nothing in this article is intended to be investment advice.

Recommended content


Recommended content

Editors’ Picks

EUR/USD retreats to 1.0700 area following post-PCE jump

EUR/USD retreats to 1.0700 area following post-PCE jump

After spiking to a daily high of 1.0720 with the immediate reaction to US PCE inflation data, EUR/USD lost its traction and declined to the 1.0700 area. Investors remain cautious ahead of this weekend's French election and make it difficult for the Euro to gather strength.

EUR/USD News

GBP/USD stays below 1.2650 after US inflation data

GBP/USD stays below 1.2650 after US inflation data

GBP/USD struggles to preserve its bullish momentum and trades below 1.2650 in the American session on Friday. Earlier in the day, the data from the US showed that the annual core PCE inflation declined to 2.6% in May, limiting the USD's upside and helping the pair hold its ground.

GBP/USD News

Gold keeps its daily gains near $2,330 following US PCE data

Gold keeps its daily gains near $2,330 following US PCE data

Gold prices maintain their constructive bias around $2,330 after US inflation readings gauged by the PCE matched consensus in May and US yields advance slightly across the curve.

Gold News

BTC struggles around the $62,000 level

BTC struggles around the $62,000 level

Bitcoin price faces pullback resistance at the lower band of the descending wedge around $62,000. Ethereum price finds support at $3,288, the 61.8% Fibonacci retracement level. Ripple price faces resistance at $0.500, its daily resistance level.

Read more

French Elections Preview: Euro to suffer after the calm, as specter of extremists, uncertainty rise Premium

French Elections Preview: Euro to suffer after the calm, as specter of extremists, uncertainty rise

The first round of French parliamentary elections is set to trigger high uncertainty. Soothing messages from the far right and far left leave the Euro vulnerable to falls. Calm may return only after the second round of voting on  July 7.

Read more

Forex MAJORS

Cryptocurrencies

Signatures