- GBP/JPY snaps two-day uptrend, struggles around 1.5-month-old resistance line, 200-SMA and weekly horizontal hurdle.
- Sluggish MACD signals, one-week-old support line restrict seller’s entry.
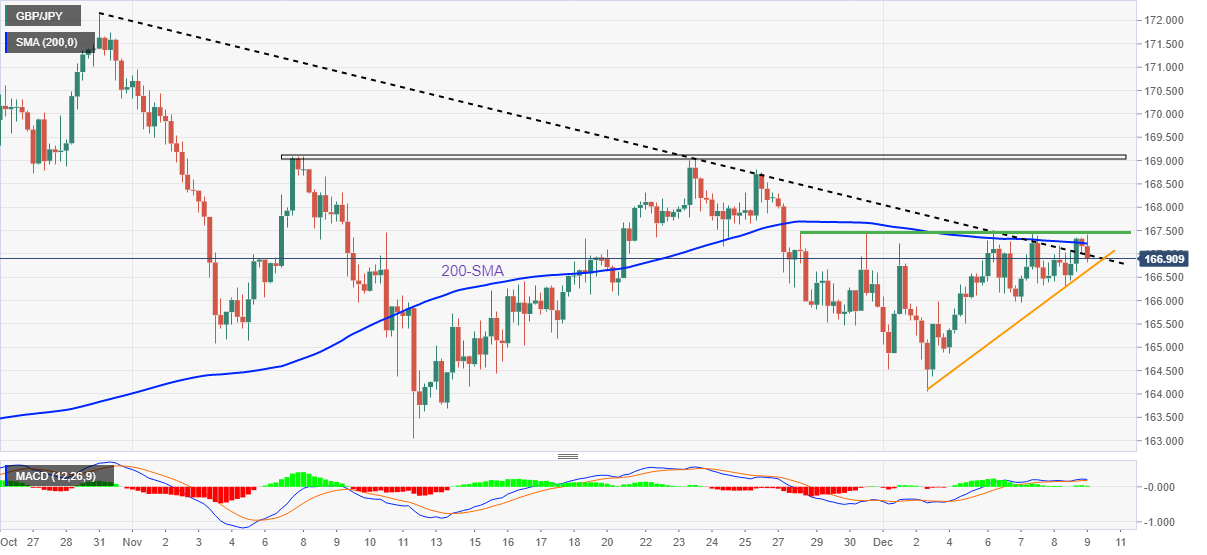
- Bulls need to cross 167.50 to aim for double tops around 169.00.
GBP/JPY remains mildly offered around 167.00 as it jostles with the short-term key hurdles during Friday. In doing so, the cross-currency pair snaps a two-day uptrend but stays on the way to weekly gains.
That said, GBP/JPY currently pokes the resistance-turned-support line from October 31, around 166.90 while reversing from the 200-SMA resistance of 167.22. Also challenging the pair buyers is the horizontal area comprising multiple tops marked since November 28, near 167.50.
It’s worth noting, however, that the sluggish MACD signals and an upward-sloping support line from the last Friday, around 166.60, restrict the GBP/JPY bear’s entry.
Following that, the 165.50 could act as an intermediate halt before directing the pair towards the monthly low near 164.00.
In a case where the GBP/JPY bears keep the reins past 164.00, the previous monthly trough surrounding 163.00 will be in focus.
On the contrary, a clear upside break of the 167.50 resistance will quickly propel the prices toward the one-month-old horizontal resistance zone near 169.00-10.
Should the GBP/JPY buyers manage to cross the 169.10 upside barrier, the odds of their rush toward the late October peak near 172.15 can’t be ruled out.
GBP/JPY: Four-hour chart
Trend: Further downside expected
Information on these pages contains forward-looking statements that involve risks and uncertainties. Markets and instruments profiled on this page are for informational purposes only and should not in any way come across as a recommendation to buy or sell in these assets. You should do your own thorough research before making any investment decisions. FXStreet does not in any way guarantee that this information is free from mistakes, errors, or material misstatements. It also does not guarantee that this information is of a timely nature. Investing in Open Markets involves a great deal of risk, including the loss of all or a portion of your investment, as well as emotional distress. All risks, losses and costs associated with investing, including total loss of principal, are your responsibility. The views and opinions expressed in this article are those of the authors and do not necessarily reflect the official policy or position of FXStreet nor its advertisers. The author will not be held responsible for information that is found at the end of links posted on this page.
If not otherwise explicitly mentioned in the body of the article, at the time of writing, the author has no position in any stock mentioned in this article and no business relationship with any company mentioned. The author has not received compensation for writing this article, other than from FXStreet.
FXStreet and the author do not provide personalized recommendations. The author makes no representations as to the accuracy, completeness, or suitability of this information. FXStreet and the author will not be liable for any errors, omissions or any losses, injuries or damages arising from this information and its display or use. Errors and omissions excepted.
The author and FXStreet are not registered investment advisors and nothing in this article is intended to be investment advice.


Recommended content
Editors’ Picks

EUR/USD remains offered in the low-1.0900s
The generalised selling pressure continues to weigh on the risk complex, pushing EUR/USD back toward the 1.0900 support level amid a growing risk-off mood, as traders assess President Trump’s reciprocal tariffs and their impact on economic activity.

GBP/USD retreats further and breaks below 1.2800
The US Dollar is picking up extra pace and flirting with daily highs, sending GBP/USD to multi-week lows near 1.2770 in a context where safe-haven demand continues to dictate sentiment amid the chaos of US tariffs.

Gold slips back below the $3,000 mark
Gold has turned lower, slipping beneath the key $3,000 mark per troy ounce amid a broad sell-off across global equity markets. The decline in the precious metal may reflect investors unwinding long positions in gold to offset mounting losses in stocks.

US stock market suddenly reverses higher after rumor of 90-day tariff pause before sinking again Premium
NASDAQ sinks 4% before shooting higher on tariff pause rumor. CNBC says White House unaware of tariff pause rumor. S&P 500 sinks to January 2024 level. Bank of America cuts its year-end target for S&P 500 by 16%.

Strategic implications of “Liberation Day”
Liberation Day in the United States came with extremely protectionist and inward-looking tariff policy aimed at just about all U.S. trading partners. In this report, we outline some of the more strategic implications of Liberation Day and developments we will be paying close attention to going forward.

The Best brokers to trade EUR/USD
SPONSORED Discover the top brokers for trading EUR/USD in 2025. Our list features brokers with competitive spreads, fast execution, and powerful platforms. Whether you're a beginner or an expert, find the right partner to navigate the dynamic Forex market.