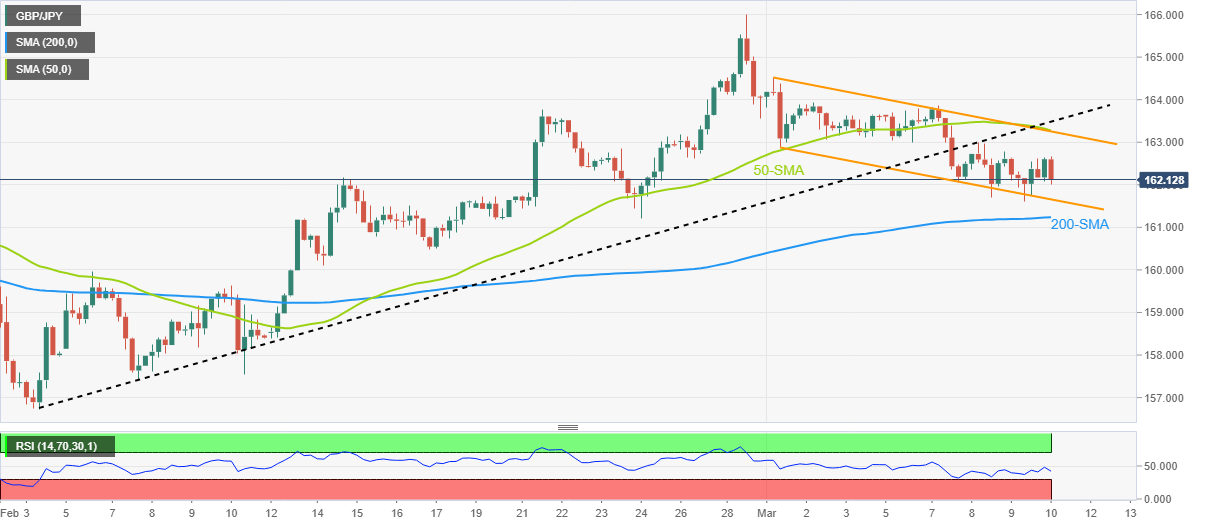
- GBP/JPY keeps the previous day’s losses around two-week low, depressed of late.
- Monthly bearish channel, sustained trading below previous support line signals further downside.
- 200-SMA appears the key challenge to bears amid sluggish RSI.
GBP/JPY holds lower ground at the intraday bottom surrounding 162.00 as pair traders await the all-important Bank of Japan (BoJ) monetary policy meeting announcements early Friday.
Also read: GBP/JPY rebounds from 162.00 ahead of UK Manufacturing data and BoJ policy
In doing so, the cross-currency pair remains inside a downward-sloping trend channel from March 01 while keeping the early week’s downside break of the five-week-old support-turned-resistance line.
It’s worth noting that the absence of an oversold RSI and the quote’s sustained trading below the 50-bar Simple Moving Average (SMA) adds strength to the bearish bias.
That said, the stated channel’s bottom line, around 161.65 by the press time, appears to put a floor under the GBP/JPY prices. Following that, the 200-SMA level, near 161.20 by the press time, acts as the last defense of the buyers.
In a case where GBP/JPY remains bearish past 161.20, the sellers may aim for the mid-February swing low surrounding 160.50 and the 160.00 round figure.
Alternatively, recovery moves can target the 163.00 round figure but may have a tough time crossing the 163.25-30 resistance confluence, encompassing the aforementioned channel’s top line and the 50-SMA.
Even if the quote rallies past 163.30, the previous support line from early February, near 163.50, could challenge the run-up before directing the GBP/JPY bulls towards the previous monthly peak surrounding 166.00.
GBP/JPY: Four-hour chart
Trend: Further downside expected
Information on these pages contains forward-looking statements that involve risks and uncertainties. Markets and instruments profiled on this page are for informational purposes only and should not in any way come across as a recommendation to buy or sell in these assets. You should do your own thorough research before making any investment decisions. FXStreet does not in any way guarantee that this information is free from mistakes, errors, or material misstatements. It also does not guarantee that this information is of a timely nature. Investing in Open Markets involves a great deal of risk, including the loss of all or a portion of your investment, as well as emotional distress. All risks, losses and costs associated with investing, including total loss of principal, are your responsibility. The views and opinions expressed in this article are those of the authors and do not necessarily reflect the official policy or position of FXStreet nor its advertisers. The author will not be held responsible for information that is found at the end of links posted on this page.
If not otherwise explicitly mentioned in the body of the article, at the time of writing, the author has no position in any stock mentioned in this article and no business relationship with any company mentioned. The author has not received compensation for writing this article, other than from FXStreet.
FXStreet and the author do not provide personalized recommendations. The author makes no representations as to the accuracy, completeness, or suitability of this information. FXStreet and the author will not be liable for any errors, omissions or any losses, injuries or damages arising from this information and its display or use. Errors and omissions excepted.
The author and FXStreet are not registered investment advisors and nothing in this article is intended to be investment advice.


Recommended content
Editors’ Picks

EUR/USD regains traction above 1.1000 ahead of US CPI release
EUR/USD has found fresh buyers and jumps above 1.1000 in the European session on Thursday. The pair gains on the German coalition deal and Trump's 90-day pause on reciprocal tariffs, which have lifted risk senitment while exacerbating the US Dollar pain ahead of the US CPI data release.

GBP/USD trades firm above 1.2850, US CPI data awaited
GBP/USD sustains the rebound above 1.2850 in European trading hours on Thursday. The British Pound capitalizes on risk appetite, courtesy of Trump's tariff pause, allowing the pair to recover ground. But further upside hinges on the US CPI data and US-Sino trade updates.

Gold price eases from weekly top amid risk-on mood; still well bid above $3,100 ahead of US CPI
Gold price trims a part of its strong intraday gains to a one-week high touched during the early European session on Thursday and currently trades just above the $3,100 mark. Concerns about escalating US-China trade tensions, along with fears about a tariffs-driven economic slowdown, turn out to be key factors that continue to underpin the safe-haven bullion.

US CPI data set to reveal March inflation dip as markets weigh impact of Trump’s tariffs
As measured by the CPI, inflation in the US is set to rise at an annual pace of 2.6% in March, down slightly from the 2.8% reported in February. Core CPI inflation, which excludes the volatile food and energy categories, is expected to ease to 3% in the same period from a year earlier

Trump’s tariff pause sparks rally – What comes next?
Markets staged a dramatic reversal Wednesday, led by a 12% surge in the Nasdaq and strong gains across major indices, following President Trump’s unexpected decision to pause tariff escalation for non-retaliating trade partners.

The Best brokers to trade EUR/USD
SPONSORED Discover the top brokers for trading EUR/USD in 2025. Our list features brokers with competitive spreads, fast execution, and powerful platforms. Whether you're a beginner or an expert, find the right partner to navigate the dynamic Forex market.