GBP/AUD technical analysis: The pair could accelerate through technical pattern


  • Post BoE rate decision GBP has seen significant losses.
  • The bearish technical pattern on the chart could break even lower.


After the Bank of England (BoE) rate decision where the vote split changed from 9-0 to 7-2. GBP has lost ground against all of its major counterparts. Like any other of the worlds central banks, the BoE has moved to take a more dovish stance. Looking at the technical picture now:

4-Hour Chart Analysis

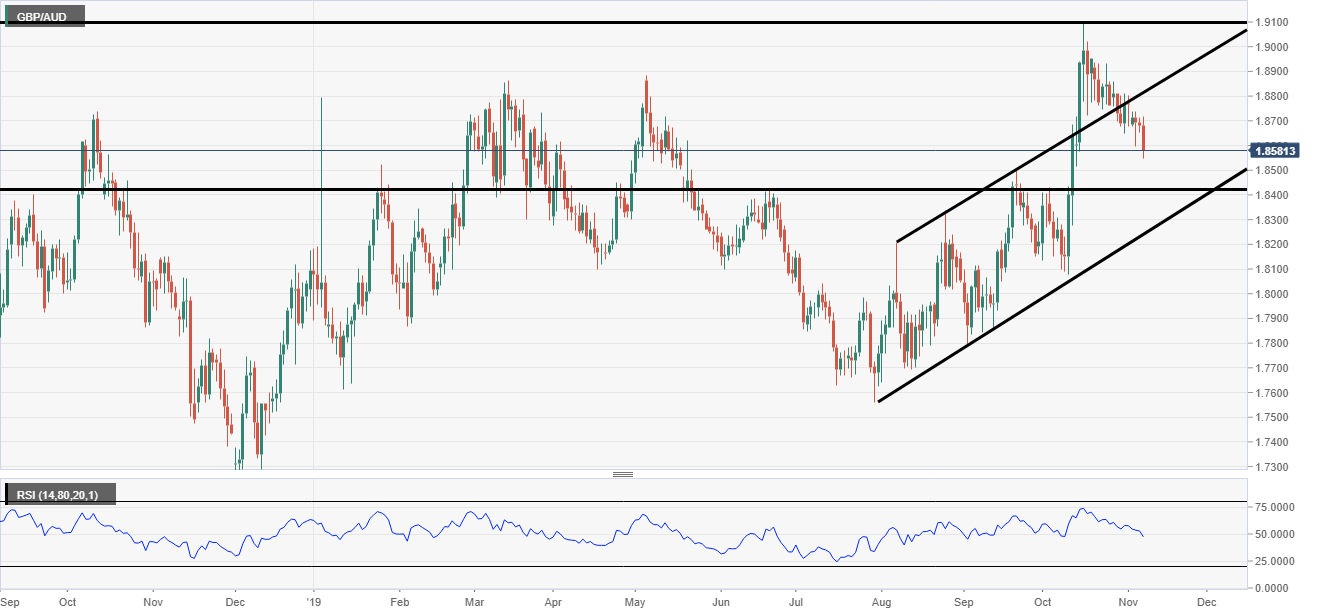
There has been a strong descending wedge formation on the 4-hour GBP/AUD chart. The market has just printed below the wedge support zone but is finding it hard to hold below. The pattern is pretty steep in any case but if the price breaks lower it would be seen as another bearish acceleration. 

The RSI has also moved under the 50 mid-line which also indicates bearishness. The key support zone next in line is at 1.8416, this is marked on the chart and has been well used in previous price action.


GBP/AUD analysis

Daily Chart Analysis

The daily chart shows is that an internal trendline has been broken to the downside. The next support zone still remains the same but there is another trendline support to keep an eye on below 1,8416. The RSI looks like it preparing for a bullish failure swing. This is when the indicator makes a lower low but the price is making higher lows. This could take some time to transpire so the bullish case may have to take a backstep for now.

GBP/AUD analysis

GBP/AUD

Overview
Today last price 1.8577
Today Daily Change  -0.0102
Today Daily Change %  -0.55
Today daily open 1.8679
 
Trends
Daily SMA20 1.8768
Daily SMA50 1.8408
Daily SMA100 1.8176
Daily SMA200 1.8281
 
Levels
Previous Daily High 1.8715
Previous Daily Low 1.8652
Previous Weekly High 1.8857
Previous Weekly Low 1.8647
Previous Monthly High 1.9096
Previous Monthly Low 1.8077
Daily Fibonacci 38.2% 1.8676
Daily Fibonacci 61.8% 1.8691
Daily Pivot Point S1 1.8649
Daily Pivot Point S2 1.8619
Daily Pivot Point S3 1.8586
Daily Pivot Point R1 1.8712
Daily Pivot Point R2 1.8745
Daily Pivot Point R3 1.8775


Share: Feed news

All information and content on this website, from this website or from FX daily ltd. should be viewed as educational only. Although the author, FX daily ltd. and its contributors believe the information and contents to be accurate, we neither guarantee their accuracy nor assume any liability for errors. The concepts and methods introduced should be used to stimulate intelligent trading decisions. Any mention of profits should be considered hypothetical and may not reflect slippage, liquidity and fees in live trading. Unless otherwise stated, all illustrations are made with the benefit of hindsight. There is risk of loss as well as profit in trading. It should not be presumed that the methods presented on this website or from material obtained from this website in any manner will be profitable or that they will not result in losses. Past performance is not a guarantee of future results. It is the responsibility of each trader to determine their own financial suitability. FX daily ltd. cannot be held responsible for any direct or indirect loss incurred by applying any of the information obtained here. Futures, forex, equities and options trading contains substantial risk, is not for every trader, and only risk capital should be used. Any form of trading, including forex, options, hedging and spreads, contains risk. Past performance is not indicative of future FX daily ltd. are not Registered Financial Investment Advisors, securities brokers-dealers or brokers of the U.S. Securities and Exchange Commission or with any state securities regulatory authority OR UK FCA. We recommend consulting with a registered investment advisor, broker-dealer, and/or financial advisor. If you choose to invest, with or without seeking advice, then any consequences resulting from your investments are your sole responsibility FX daily ltd. does not assume responsibility for any profits or losses in any stocks, options, futures or trading strategy mentioned on the website, newsletter, online trading room or trading classes. All information should be taken as educational purposes only.

Pepperstone
Sponsor
Account
8.2
Tools
8.2
Service
7.4
Trading
9
Trust
8.8
Experience
9
Read Review
Account
7.2
Tools
9.2
Service
9.6
Trading
8.4
Trust
7
Experience
8.4
Read Review
Account
7.4
Tools
6.6
Service
8
Trading
6.6
Trust
5.2
Experience
9.2
Read Review
Pepperstone
Sponsor
Account
8.2
Tools
8.2
Service
7.4
Trading
9
Trust
8.8
Experience
9
Read Review
Account
7.2
Tools
9.2
Service
9.6
Trading
8.4
Trust
7
Experience
8.4
Read Review
Account
7.4
Tools
6.6
Service
8
Trading
6.6
Trust
5.2
Experience
9.2
Read Review

Recommended content


Recommended content

Editors’ Picks

EUR/USD holds losses near 1.1350 as US Dollar gains on US-China trade optimism

EUR/USD holds losses near 1.1350 as US Dollar gains on US-China trade optimism

EUR/USD consoldiates losses near 1.1350 in European trading on Friday. Broad US Dollar resurgence on optimism surrounding the US-China trade war de-escalation keeps the he pair  undermined. Trade talks and US data remain in focus. 

EUR/USD News
GBP/USD stays pressured near 1.3300 after UK Retail Sales data

GBP/USD stays pressured near 1.3300 after UK Retail Sales data

GBP/USD remains under moderate selling pressure near 1.3300 despite the upbeat UK Retail Sales data for March. The pair feels the heat of the solid US Dollar rebound, aided by a Bloomberg report, which indicated China may suspend its 125% tariff on select US imports. 

GBP/USD News
Gold price recovers above $3,300 after China denies tariff negotiations

Gold price recovers above $3,300 after China denies tariff negotiations

Gold price recovers slightly from the daily low and climbs back above the $3,300 mark in Friday's European session. China's Foreign Ministry denied any ongoing negotiations with the US on tariffs, keeping a lid on the optimism in the markets and lending some support to the safe-haven precious metal.

Gold News
Ethereum: Accumulation addresses grab 1.11 million ETH as bullish momentum rises

Ethereum: Accumulation addresses grab 1.11 million ETH as bullish momentum rises

Ethereum saw a 1% decline on Friday as sellers dominated exchange activity in the past 24 hours. Despite the recent selling, increased inflows into accumulation addresses and declining net taker volume show a gradual return of bullish momentum.

Read more
Five fundamentals for the week: Traders confront the trade war, important surveys, key Fed speech

Five fundamentals for the week: Traders confront the trade war, important surveys, key Fed speech Premium

Will the US strike a trade deal with Japan? That would be positive progress. However, recent developments are not that positive, and there's only one certainty: headlines will dominate markets. Fresh US economic data is also of interest.

Read more
The Best brokers to trade EUR/USD

The Best brokers to trade EUR/USD

SPONSORED Discover the top brokers for trading EUR/USD in 2025. Our list features brokers with competitive spreads, fast execution, and powerful platforms. Whether you're a beginner or an expert, find the right partner to navigate the dynamic Forex market.

Read More

Forex MAJORS

Cryptocurrencies

Signatures

Best Brokers of 2025