Let's take a look at gap analysis to see which ones are likely to fill and when.
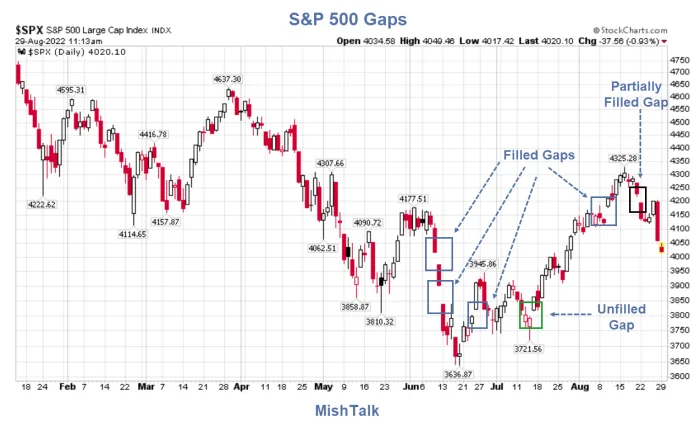
S&P 500 chart courtesy of StockCharts, annotations by Mish
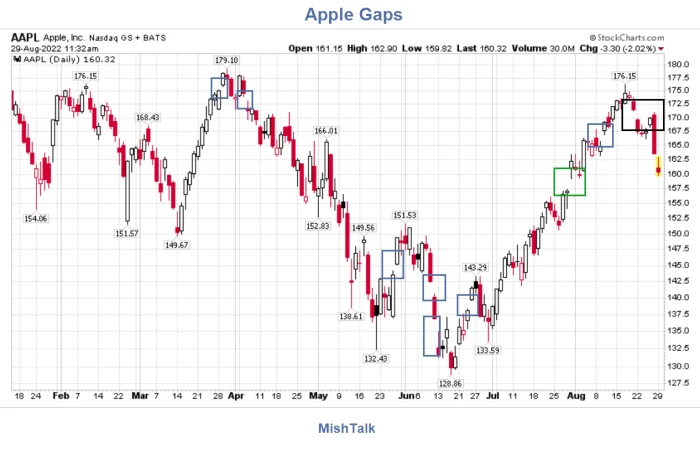
Filled gaps are in blue, partially filled gaps are in black, and unfilled gaps are in green.
What are gaps?
Gaps occur when the stock market opens up higher than the high of the previous day or down lower than the low of the previous day.
Gaps tend to fill sooner rather than later, but some last for years before filling. A small number never close.
S&P 500 gap analysis
The decline from the S&P 500 peak at 4818 to 3810 was orderly the entire way, leaving no gaps that were not quickly filled.
In early June the S&P 500 gapped down twice hard. That provided a warning signal to bears. In late June there was a gap up that filled before the end of the month.
On August 10, there was a big gap up, now filled. On August 22, there was a gap down that is partially filled. I suspect that will satisfy the gap gods.
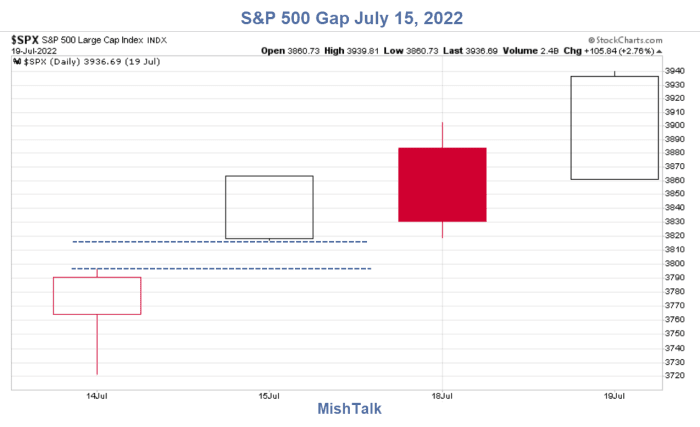
The main unfilled gap below is on July 15.
S&P 500 gap July 15, 2022
S&P 500 chart courtesy of StockCharts, annotations by Mish
I expect that gap to fill easily, sooner rather than later.
Nasdaq 100 Index gaps
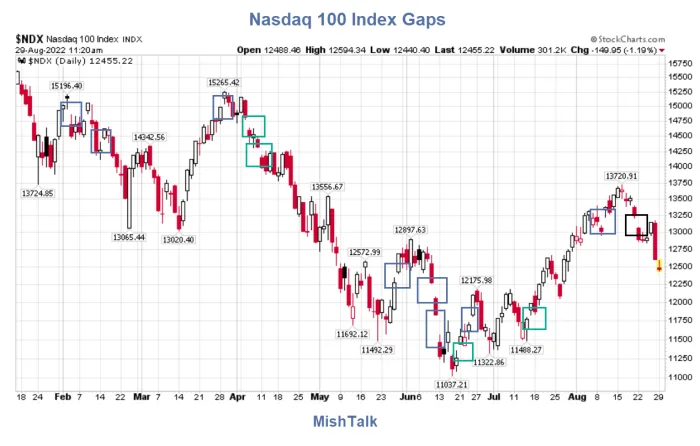
Nasdaq 100 Index chart courtesy of StockCharts, annotations by Mish
Filled gaps are in blue, partially filled gaps are in black, and unfilled gaps are in green.
Compared the S&P 500 the Nasdaq is very disorderly. There are huge gaps down in early April that are unfilled. I expect those gaps will fill, but not for many years.
There is a partial fill of the gap down on August 22. As with the S&P 500, that may satisfy the gap gods.
I expect the two open gaps below to fill sooner rather than later. The target is about 11350.
S&P 500 weekly chart
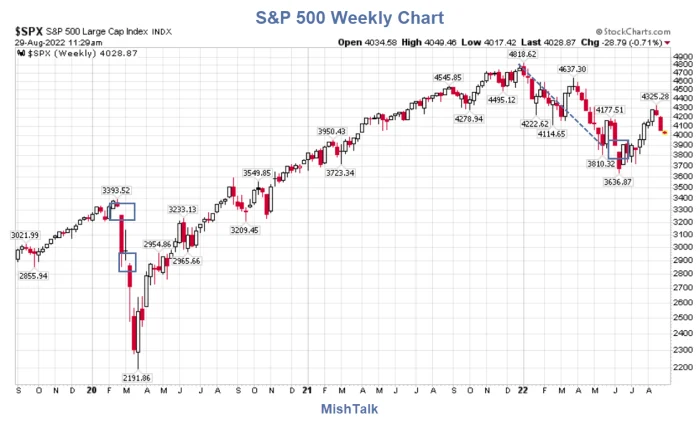
S&P 500 weekly chart courtesy of StockCharts, annotations by Mish
The pandemic gaps down closed within about 6 months thanks to the biggest stimulus in history.
The gap down in June closed within a month.
Apple
Apple chart courtesy of StockCharts, annotations by Mish
Apple has a gap at 155 that I expect will fill easily.
S&P 500 monthly support levels
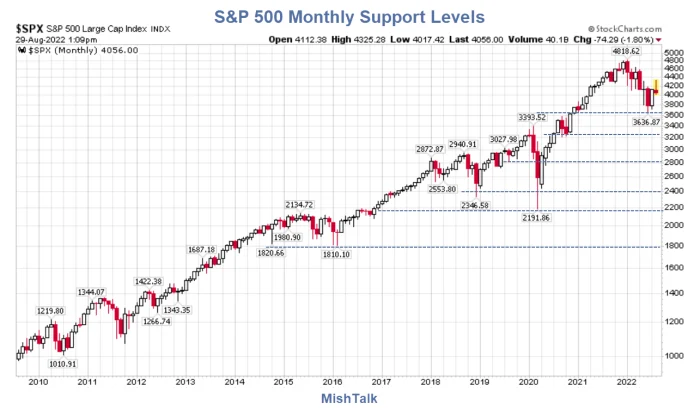
S&P 500 monthly chart courtesy of StockCharts, annotations by Mish
My primary downside target is 2400. Stocks would not even be cheap at that level. 1800 or lower is not out of the question.
I am also open to the idea that 2800 is the bottom but I highly doubt that.
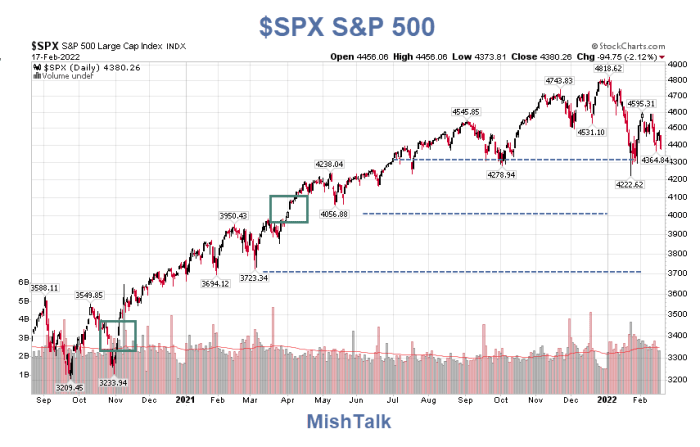
My downside targets have not changed since I first started posting them on February 18, 2022.
Here is the chart I posted then.
$SPX chart posted February 18
That gap just above 4000 has now been closed. There is another one around 3400 that I believe is a near given will close.
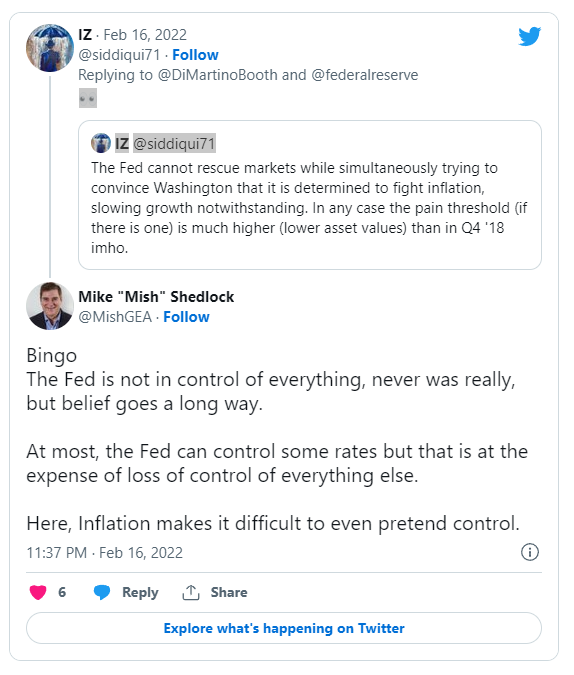
My Tweet at the time
IZ
The Fed cannot rescue markets while simultaneously trying to convince Washington that it is determined to fight inflation, slowing growth notwithstanding. In any case the pain threshold (if there is one) is much higher (lower asset values) than in Q4 '18 imho.
Mish
Bingo The Fed is not in control of everything, never was really, but belief goes a long way.
At most, the Fed can control some rates but that is at the expense of loss of control of everything else.
Here, Inflation makes it difficult to even pretend control.
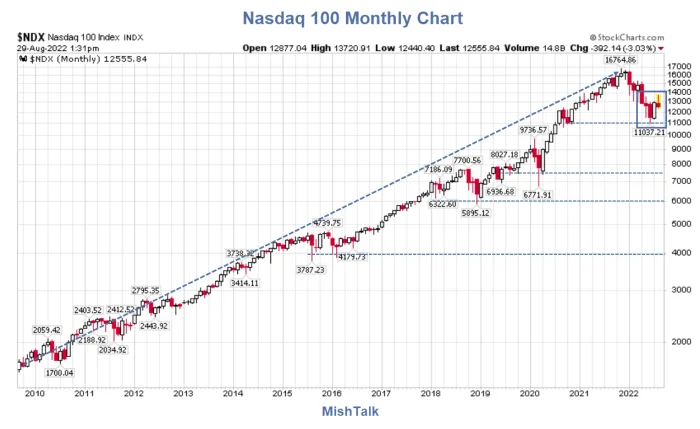
Nasdaq 100 monthly chart
Nasdaq 100 monthly chart courtesy of StockCharts, annotations by Mish
Where to from here?
I strongly suggest a minimum decline to the 7500 level but perhaps 6000 or so is more likely. That would be a decline of 64 percent, a typical, not extreme bear market.
Bear in mind that would only take out 3.5 years of a 12 year bull market to a level seen in 2019.
This is the bubble the Fed created.
Fed Chair Jerome Powell pledges to "act with resolve" to beat inflation
Bear in mind that in Jackson Hole last week, Fed Chair Jerome Powell Pledges to "Act With Resolve" to Beat Inflation.
Key comments: "Reducing inflation is likely to require a sustained period of below-trend growth."
See the above link for many other important comments and an important discussion of inflation expectations.
Expect a long period of weak growth, whether or not it's labeled recession
On August 19, I repeated my message from earlier this year: Expect a Long Period of Weak Growth, Whether or Not It's Labeled Recession.
Powell is in agreement. We are likely in recession now, but label it however you like. It does not matter what you call it.
What does matter is stocks are priced for perfection, not a long period of weak growth.
This material is based upon information that Sitka Pacific Capital Management considers reliable and endeavors to keep current, Sitka Pacific Capital Management does not assure that this material is accurate, current or complete, and it should not be relied upon as such.
Recommended content
Editors’ Picks
EUR/USD clings to daily gains near 1.0300 after US PMI data
EUR/USD trades in positive territory at around 1.0300 on Friday. The pair breathes a sigh of relief as the US Dollar rally stalls, even as markets stay cautious amid geopolitical risks and Trump's tariff plans. US ISM PMI improved to 49.3 in December, beating expectations.

GBP/USD holds around 1.2400 as the mood improves
GBP/USD preserves its recovery momentum and trades around 1.2400 in the American session on Friday. A broad pullback in the US Dollar allows the pair to find some respite after losing over 1% on Thursday. A better mood limits US Dollar gains.

Gold retreats below $2,650 in quiet end to the week
Gold shed some ground on Friday after rising more than 1% on Thursday. The benchmark 10-year US Treasury bond yield trimmed pre-opening losses and stands at around 4.57%, undermining demand for the bright metal. Market players await next week's first-tier data.

Stellar bulls aim for double-digit rally ahead
Stellar extends its gains, trading above $0.45 on Friday after rallying more than 32% this week. On-chain data indicates further rally as XLM’s Open Interest and Total Value Locked rise. Additionally, the technical outlook suggests a rally continuation projection of further 40% gains.

Week ahead – US NFP to test the markets, Eurozone CPI data also in focus
King Dollar flexes its muscles ahead of Friday’s NFP. Eurozone flash CPI numbers awaited as euro bleeds. Canada’s jobs data to impact bets of a January BoC cut. Australia’s CPI and Japan’s wages also on tap.

Best Forex Brokers with Low Spreads
VERIFIED Low spreads are crucial for reducing trading costs. Explore top Forex brokers offering competitive spreads and high leverage. Compare options for EUR/USD, GBP/USD, USD/JPY, and Gold.
