- NFT rumours drive GME stock higher on Monday.
- GameStop losses a top executive as the COO leaves.
- GME shares surge 8% on Monday despite the COO news.
Update: GameStop has stabilized after the strong move and pushed higher on Tuesday, marking up to nearly $210 for a gain of 4.5%. The stock broke out on Monday and has seen continued buying from retail traders. Talk of NFT business has been widely circulating among retail traders on social media.
GameStop (GME) breakout alert! Is the original meme stock back? The stock certainly made its move yesterday with a surge of over 8% to take it out of the slumber zone and back onto retail traders' attention. In percentage terms, GameStop has now turned positive for the last month and looks set for more gains as it flags a breakout, which we will discuss further down.
GME 15-minute chart
GameStop (GME) stock news
So why the move on Monday? News of a COO's departure would usually be taken as a negative, especially as she was not long in the job and had a wealth of experience. Jenna Owens agreed to leave, according to GameStop, just seven months after joining. She had been a top executive at Amazon (AMZN) and Alphabet (GOOGL). There was not much more detail given except that she is to leave immediately (actually left as of October 25) and a separation agreement was in place.
On Monday though, GameStop surged over 8%. Various social media sites are talking of a potential pivot into the non-fungible token (NFT) business for GameStop, and the talk has increased markedly on this front over the weekend. NFTs are seen as a lucrative add-on business for GameStop (GME).
Gamestop (GME) stock forecast
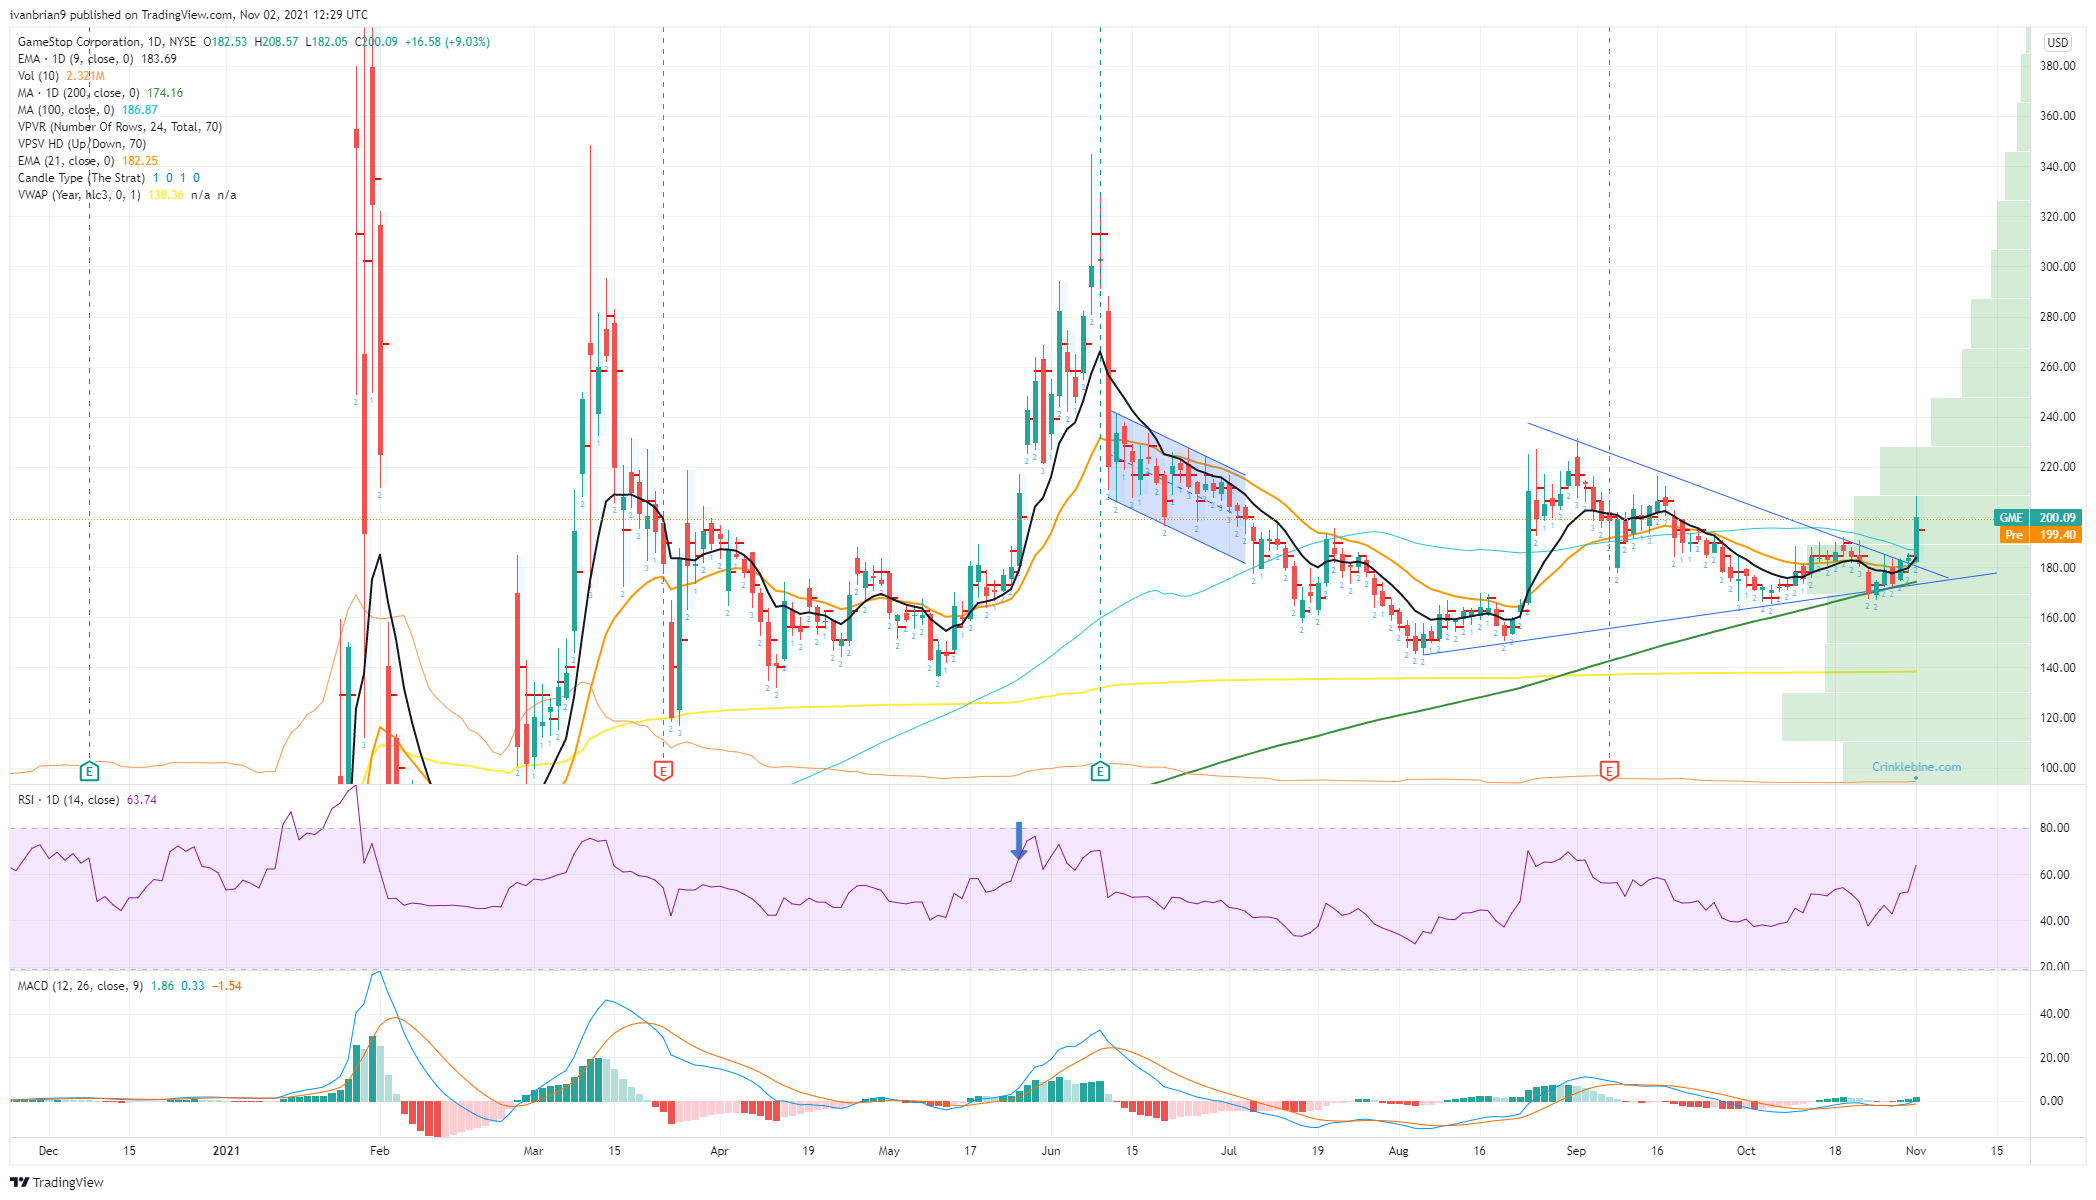
Newsflow both positive and negative then is in evidence, but the simple fact is clear from the chart below that this is a breakout play with momentum traders then rolling in behind the move. Witness the contraction in volume and price resulting in the triangle formation we see in the GME chart below. Triangles nearly always lead to a breakout, and this is clearly what we have got. GameStop also found support perfectly from the 200-day moving average, so keep an eye on this for future reference. The target is the size of the entry of the triangle, meaning $260 approximately. Note that no technical analysis is set in stone. These are estimated targets based on breakout theory. The key support is the breakout level at $183. Holding $183 keeps GME stock bullish, but below and it is back to neutral. Resistance is at $231, the top of the triangle and September 1 high. The RSI has also neatly popped above 50, adding to the confirmation bias.
GME 1-day chart
Information on these pages contains forward-looking statements that involve risks and uncertainties. Markets and instruments profiled on this page are for informational purposes only and should not in any way come across as a recommendation to buy or sell in these assets. You should do your own thorough research before making any investment decisions. FXStreet does not in any way guarantee that this information is free from mistakes, errors, or material misstatements. It also does not guarantee that this information is of a timely nature. Investing in Open Markets involves a great deal of risk, including the loss of all or a portion of your investment, as well as emotional distress. All risks, losses and costs associated with investing, including total loss of principal, are your responsibility. The views and opinions expressed in this article are those of the authors and do not necessarily reflect the official policy or position of FXStreet nor its advertisers. The author will not be held responsible for information that is found at the end of links posted on this page.
If not otherwise explicitly mentioned in the body of the article, at the time of writing, the author has no position in any stock mentioned in this article and no business relationship with any company mentioned. The author has not received compensation for writing this article, other than from FXStreet.
FXStreet and the author do not provide personalized recommendations. The author makes no representations as to the accuracy, completeness, or suitability of this information. FXStreet and the author will not be liable for any errors, omissions or any losses, injuries or damages arising from this information and its display or use. Errors and omissions excepted.
The author and FXStreet are not registered investment advisors and nothing in this article is intended to be investment advice.
Recommended content
Editors’ Picks

GBP/USD consolidates around 1.2700 mark ahead of UK CPI, FOMC decision
GBP/USD lacks any firm intraday direction and oscillates in a range on Wednesday. The fundamental backdrop warrants some caution for aggressive bearish traders. Traders opt to wait for the UK November CPI report and the crucial FOMC decision.

EUR/USD strengthens above 1.0500, all eyes are on Fed rate decision
The EUR/USD pair holds positive ground to near 1.0505 during the early European session on Wednesday. However, the cautious sentiment ahead of the Federal Reserve interest rate decision meeting could weigh on riskier assets like the Euro.

Gold price struggles to lure buyers amid elevated US bond yields; FOMC decision awaited
Gold price attracts fresh sellers following an Asian session uptick to the $2,652 region, albeit it manages to hold its neck above a more than one-week low touched on Tuesday. Expectations that the Federal Reserve will adopt a more cautious stance on cutting interest rates remain supportive of elevated US Treasury bond yields.

Bitcoin, Ethereum and Ripple show signs of short-term correction
Bitcoin price edges slightly down during the Asian session on Wednesday. Ethereum and Ripple followed BTC’s footsteps and declined slightly; all coins’ technical indicators and price action suggest a possible short-term correction on the cards.

DJIA ends Tuesday in the red, sheds roughly 270 points
The Dow Jones Industrial Average shed another 360 points at its lowest on Tuesday as losses accumulate in the key index and begin to gather speed. The S&P 500 and the Nasdaq also closed in the red.

Best Forex Brokers with Low Spreads
VERIFIED Low spreads are crucial for reducing trading costs. Explore top Forex brokers offering competitive spreads and high leverage. Compare options for EUR/USD, GBP/USD, USD/JPY, and Gold.
-637714517714150333.png)
