- FuelCell Energy is stable on Thursday, closing down 0.25%.
- FCEL stock ignited earlier this week with an 18% surge.
- FuelCell winning new retail trading fans, but can the rally continue?
FuelCell Energy (FCEL) shares were pretty quiet on Thursday in a bit of a change for the latest hot retail stock. The name had popped on Monday as heavy social media chatter had seen increased interest among retail traders. The stock duly took off and gained 18% on Monday. Nothing like momentum to draw in some new buyers, but FCEL stock has struggled since then. It has since posted three red days in a row. Crucially from a technical view though, it has held up reasonably well and not traded lower than Monday's low.
The move in FCEL did stagger a bit mid-week when news broke that the clean energy provision of the massive stimulus bill may not make it through the Senate. It was being reported that Senator Joe Manchin was not going to support the bill. Clean energy stocks did wobble a bit on the news, and FuelCell certainly is in this sector. Mentions on social media as we can see below from the Refinitiv social media monitor continue to fall. This is in line with the share price fall. Given FCEL is a retail momentum name, it needs to stay in the limelight, so we take this as a bearish sign.
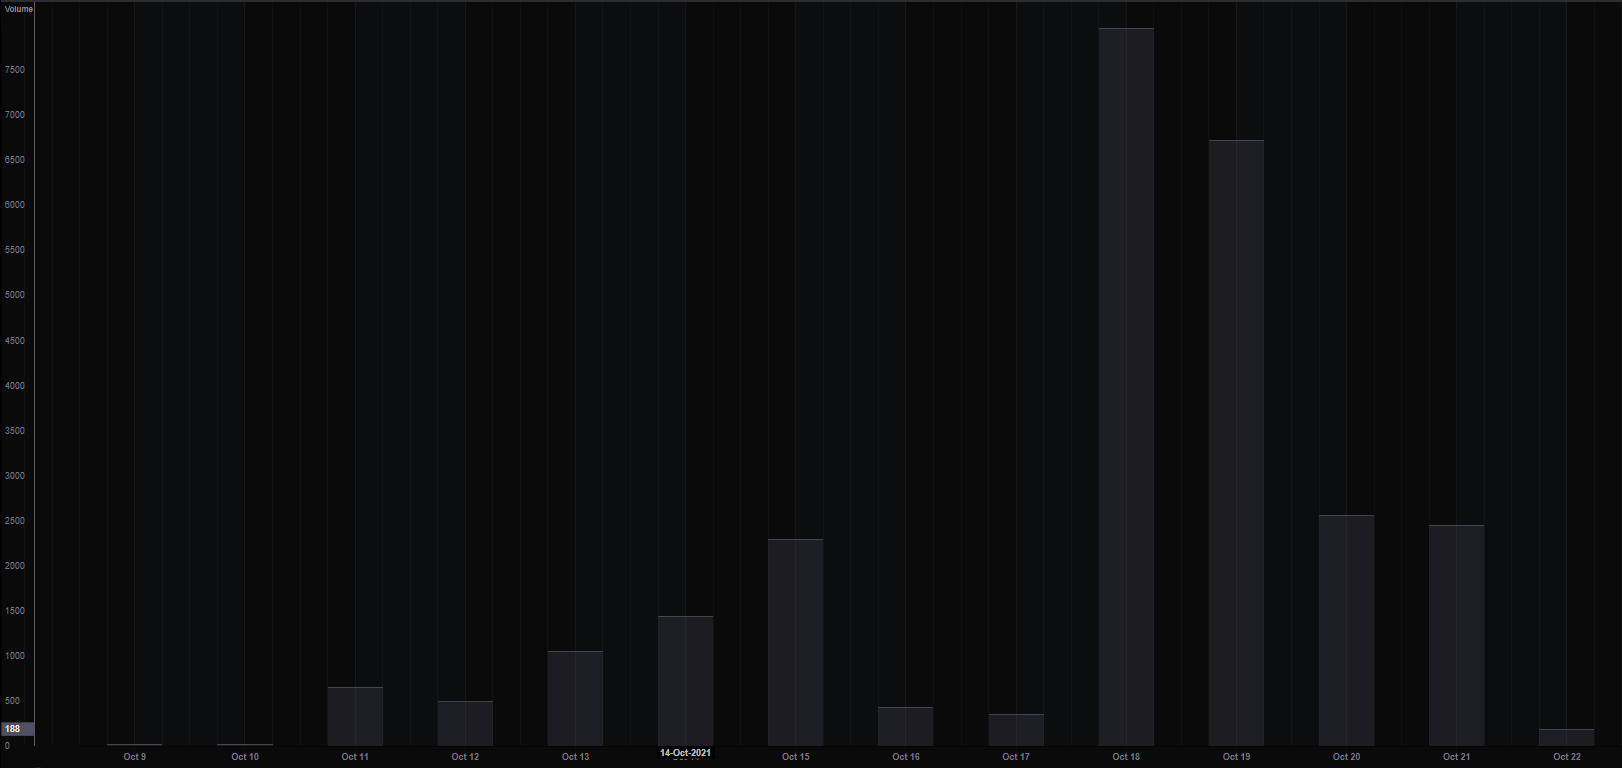
Source: Refinitiv
FuelCell (FCEL) stock forecast
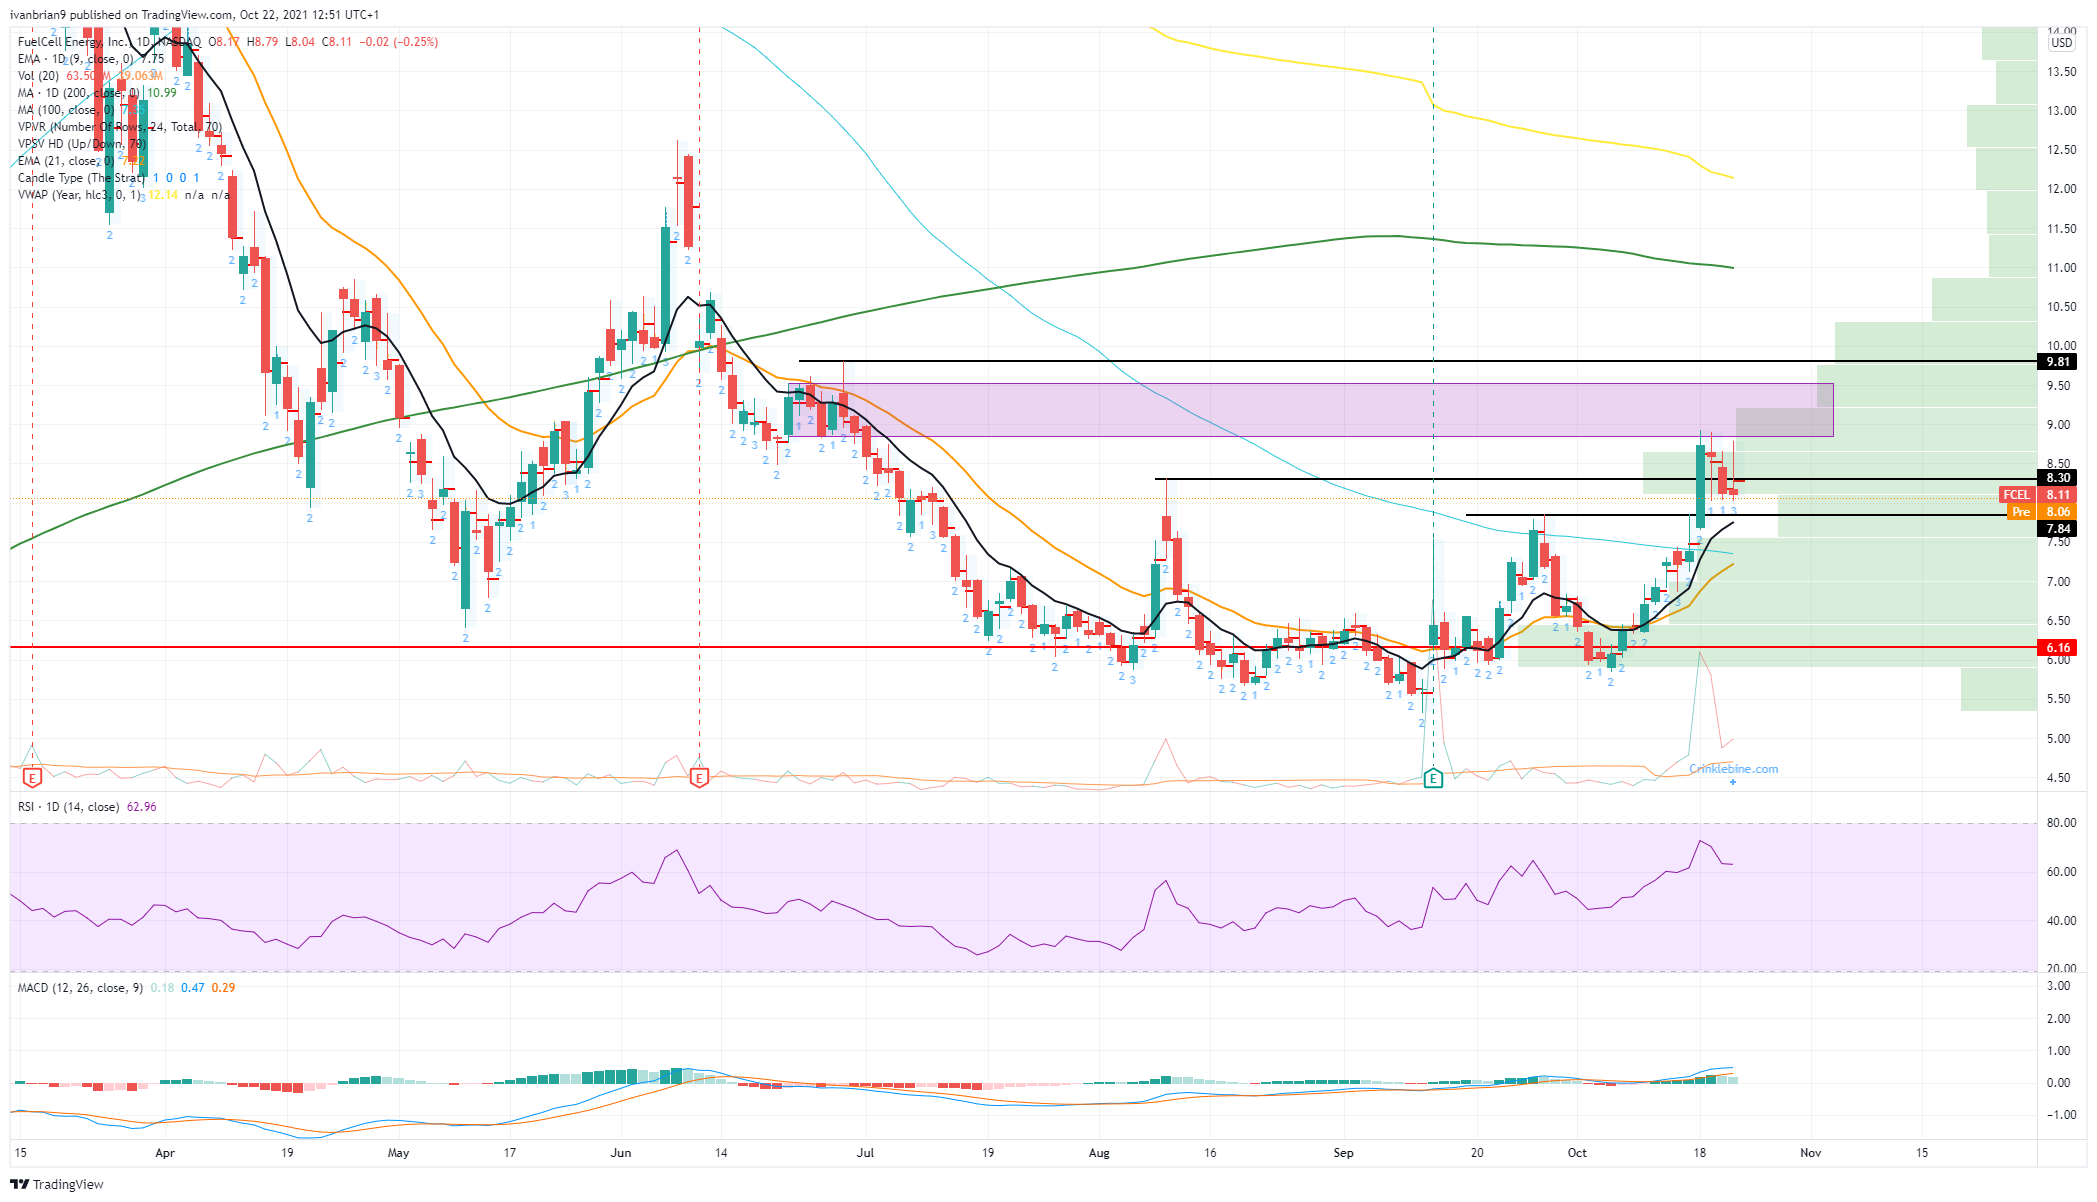
The strong spike on Monday topped out at our resistance zone (highlighted). This is the consolidation phase from back in June. This stopped the losses in FCEL share price for a time before moving lower again. There is clearly some supply at this level, making it a source of resistance. FCEL stock though has held above $8, and that is a key level. Not only is it a nice, even, round number, but now it is helping with the formation of a flag pattern. The strong move followed by the consolidation forms a bull flag pattern. Given that we call it a bull flag pattern, you can guess then that it is bullish.
Rather, it is bullish so long as the bottom of the flag holds as support. This is at $8. Breaking below will end the bullish trend in our view. If it holds, consolidates and manages to break higher, then this old consolidation zone around $9 to $9.50 will serve as resistance. Once above $10.50, things really thin out in terms of volume, so gains would then be easier to sustain. Breaking the flag would bring support from the 100-day moving average into play at $7.35 and then $6.16, which is a high volume zone and the point of control.
Information on these pages contains forward-looking statements that involve risks and uncertainties. Markets and instruments profiled on this page are for informational purposes only and should not in any way come across as a recommendation to buy or sell in these assets. You should do your own thorough research before making any investment decisions. FXStreet does not in any way guarantee that this information is free from mistakes, errors, or material misstatements. It also does not guarantee that this information is of a timely nature. Investing in Open Markets involves a great deal of risk, including the loss of all or a portion of your investment, as well as emotional distress. All risks, losses and costs associated with investing, including total loss of principal, are your responsibility. The views and opinions expressed in this article are those of the authors and do not necessarily reflect the official policy or position of FXStreet nor its advertisers. The author will not be held responsible for information that is found at the end of links posted on this page.
If not otherwise explicitly mentioned in the body of the article, at the time of writing, the author has no position in any stock mentioned in this article and no business relationship with any company mentioned. The author has not received compensation for writing this article, other than from FXStreet.
FXStreet and the author do not provide personalized recommendations. The author makes no representations as to the accuracy, completeness, or suitability of this information. FXStreet and the author will not be liable for any errors, omissions or any losses, injuries or damages arising from this information and its display or use. Errors and omissions excepted.
The author and FXStreet are not registered investment advisors and nothing in this article is intended to be investment advice.


Recommended content
Editors’ Picks

AUD/USD: A challenge of the 2025 peaks looms closer
AUD/USD rose further, coming closer to the key resistance zone around 0.6400 despite the strong rebound in the Greenback and the mixed performance in the risk-associated universe. The pair’s solid price action was also propped up by a firm jobs report in Oz.

EUR/USD: Extra gains likely above 1.1400
EUR/USD came under renewed downside pressure following another bull run to the 1.1400 region on Thursday. The knee-jerk in spot came in response to the decent bounce in the US Dollar, while the dovish tone from the ECB’s Lagarde seems to have also contributed to the bearish developments in the pair.

Gold bounces off daily lows, back near $3,320
The prevailing risk-on mood among traders challenges the metal’s recent gains and prompts a modest knee-jerk in its prices on Thursday. After bottoming out near the $3,280 zone per troy ounce, Gold prices are now reclaiming the $3,320 area in spite of the stronger Greenback.

Canada launches world's first Solana ETF as $270M in staking deposits propel SOL price above BTC and ETH
Solana price jumps on Thursday as Canadian firm launches the world’s first SOL ETF, fueling bullish sentiment alongside $270 million in new staking deposits this week.

Future-proofing portfolios: A playbook for tariff and recession risks
It does seem like we will be talking tariffs for a while. And if tariffs stay — in some shape or form — even after negotiations, we’ll likely be talking about recession too. Higher input costs, persistent inflation, and tighter monetary policy are already weighing on global growth.

The Best brokers to trade EUR/USD
SPONSORED Discover the top brokers for trading EUR/USD in 2025. Our list features brokers with competitive spreads, fast execution, and powerful platforms. Whether you're a beginner or an expert, find the right partner to navigate the dynamic Forex market.