FuelCell Energy Inc Stock Price and Forecast: Why did FCEL stock fall 12% on Wednesday?
- FuelCell Energy (FCEL) stock fell over 12% on Wednesday.
- FuelCell (FCEL) stock fell below support at the $5.85 level.
- FuelCell Energy (FCEL) shares now targetting sub $3 technically.

FuelCell Energy brought disappointment to holders on Wednesday as the stock closed nearly 13% lower and broke some key supports on the way. The stock had been a retail favorite so will not have brought a happy end to the year for investors. FuelCell (FCEL) stock is down 42% in the last month alone and down over 54% for the year so far with just two sessions left.
FuelCell Energy (FCEL) stock news
Earnings were the catalyst yesterday for more losses. Earnings per share (EPS) came in worse than expected at -$0.07 versus -$0.04 expected. Revenue came in at $13.935 million versus the $21.77 million estimates. FCEL shares had begun the week positively after the company announced it had reached an agreement with POSCO Energy. "We are extremely pleased to have reached a favorable agreement with POSCO which confirms our access to the Asian market for FuelCell Energy," said Jason Few, president and CEO of FuelCell. However, the stock could not hold those gains and looked ominous even before earnings.
FuelCell Energy (FCEL) stock forecast
The earnings report saw FCEL stock break some key support levels and will likely see more losses ahead as stop losses are triggered below $5. Our call from yesterday identified the key support level and so it proved with a powerful break. "The daily chart shows a strong negative trend but the close yesterday at $5.87 is just on support from the last low of $5.86 back in October. This is a small crumb of comfort but a break of this support would lead to fresh losses with sub $5 likely targetted". FCEL stock is trading at $5.05 in Thursday's premarket.
Now that $5.85/6 support is gone $5 will be the natural target. Momentum is totally gone here and these retail stocks need momentum to drive them. Breaking $5 will see a volume gap, identified by the green bars on the right of the chart below. A volume gap means a sharp move is more likely as there is no price discovery. We can see the gap in volume until $3.
Support $5 and $3. Resistance at $5.85 and $6.58.
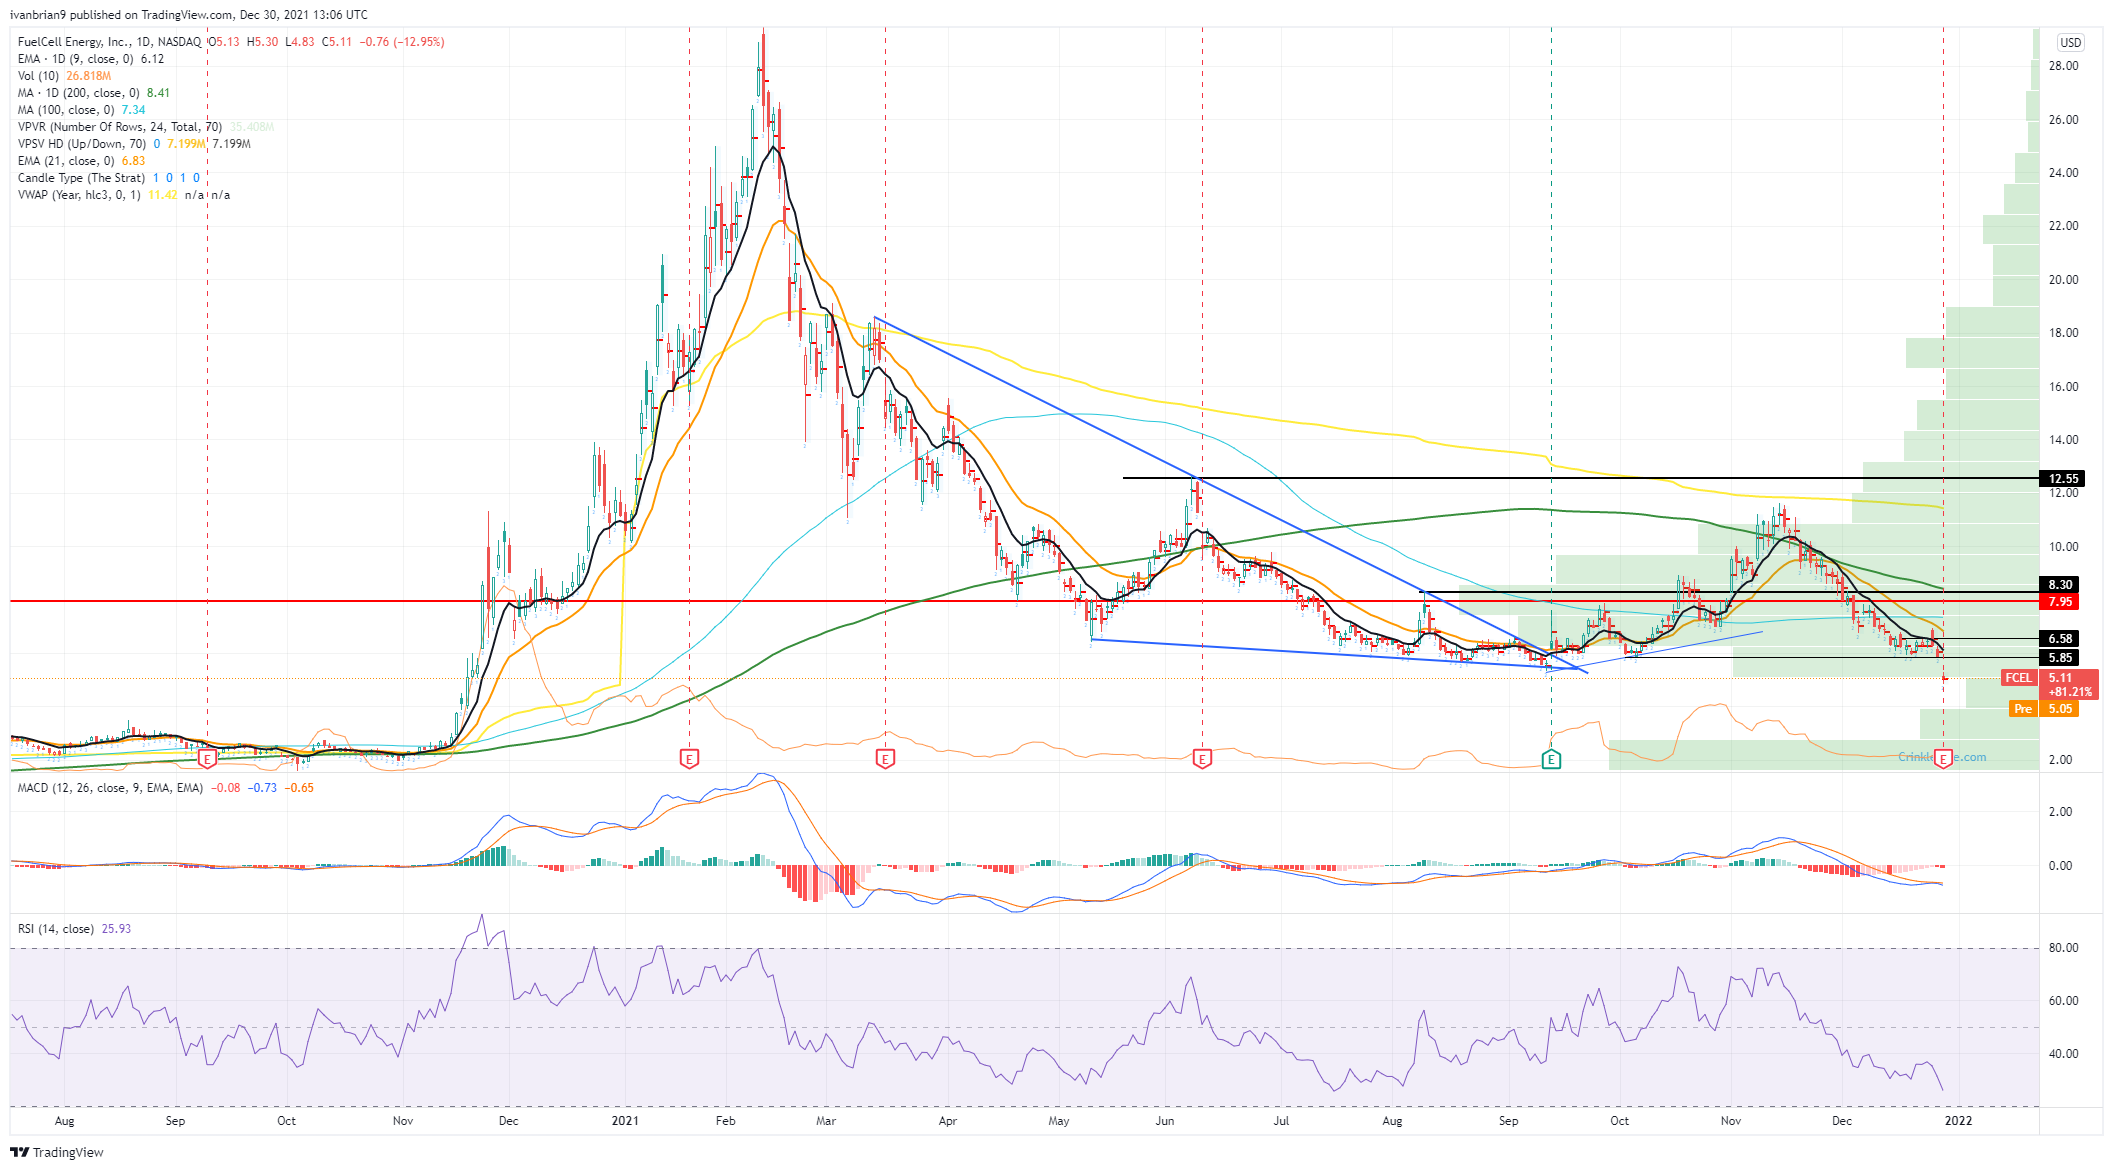
FuelCell Energy (FCEL) chart, daily
Like this article? Help us with some feedback by answering this survey:
Premium
You have reached your limit of 3 free articles for this month.
Start your subscription and get access to all our original articles.
Author

Ivan Brian
FXStreet
Ivan Brian started his career with AIB Bank in corporate finance and then worked for seven years at Baxter. He started as a macro analyst before becoming Head of Research and then CFO.


