- FuboTV staged an impressive 12% rally on Friday.
- FUBO still in a bearish trend but key resistance levels await testing.
- FUBO is a meme stock favourite, having surged in early 2021.
FUBO shares staged a strong rally to finish out Friday, gaining 12% to close at $23.31.
FuboTV is a sports-centric streaming company. It offers customers live streaming sports events as well as news and discussion programmes focusing on the major sports events of the current time. FuboTV offers streaming across multiple devices, with subscription services and additional fees for enhanced or additional sporting events.
Fubo stock forecast
The catalyst for Friday's move was the announcement by FUBO that it has secured the rights to the 2022 World Cup qualifying matches for South American teams.
This looks to have ensured FUBO has put in a nice bottom on the chart and is now targetting a breakout of the recent range.
The first resistance level to break is $26.13. This has added significance of being the low from March 5, also having been retested on March 26, when FUBO closed just shy of the level. A break here should see a quick move toward the higher range of $28.20 to $34.46. These levels are both 78.6% and 61.8% Fibonacci retracement levels of the last downward move from the spike highs in January. A potential rally breakout of $26.12 should not run into much resistance, as price and volume are not significant until nearer $30.
Basically, FUBO is setting up for a breakout of one range ($20.23-$26.12) toward a new one ($28.20-$34.46). Failure to break the upper resistance will likely see a continued sideways move, with a test of the lower end of the current range at $20.23.
However, bulls appear to be more favoured, as FUBO has broken above the 9-day moving average and the MACD is just about to cross over, further adding to the bullish argument. The upper end of the new range at $34.46 would also end the series of bearish lower lows and lower highs by taking out the high from March 16.
A bullish trade can be played by waiting to buy the breakout of $26.12 with a tight stop just below, as the move should not retrace quickly. Alternatively, traders who wish to get in earlier can buy at current levels with a stop below the 9-day moving average, as this is driving the current trend.
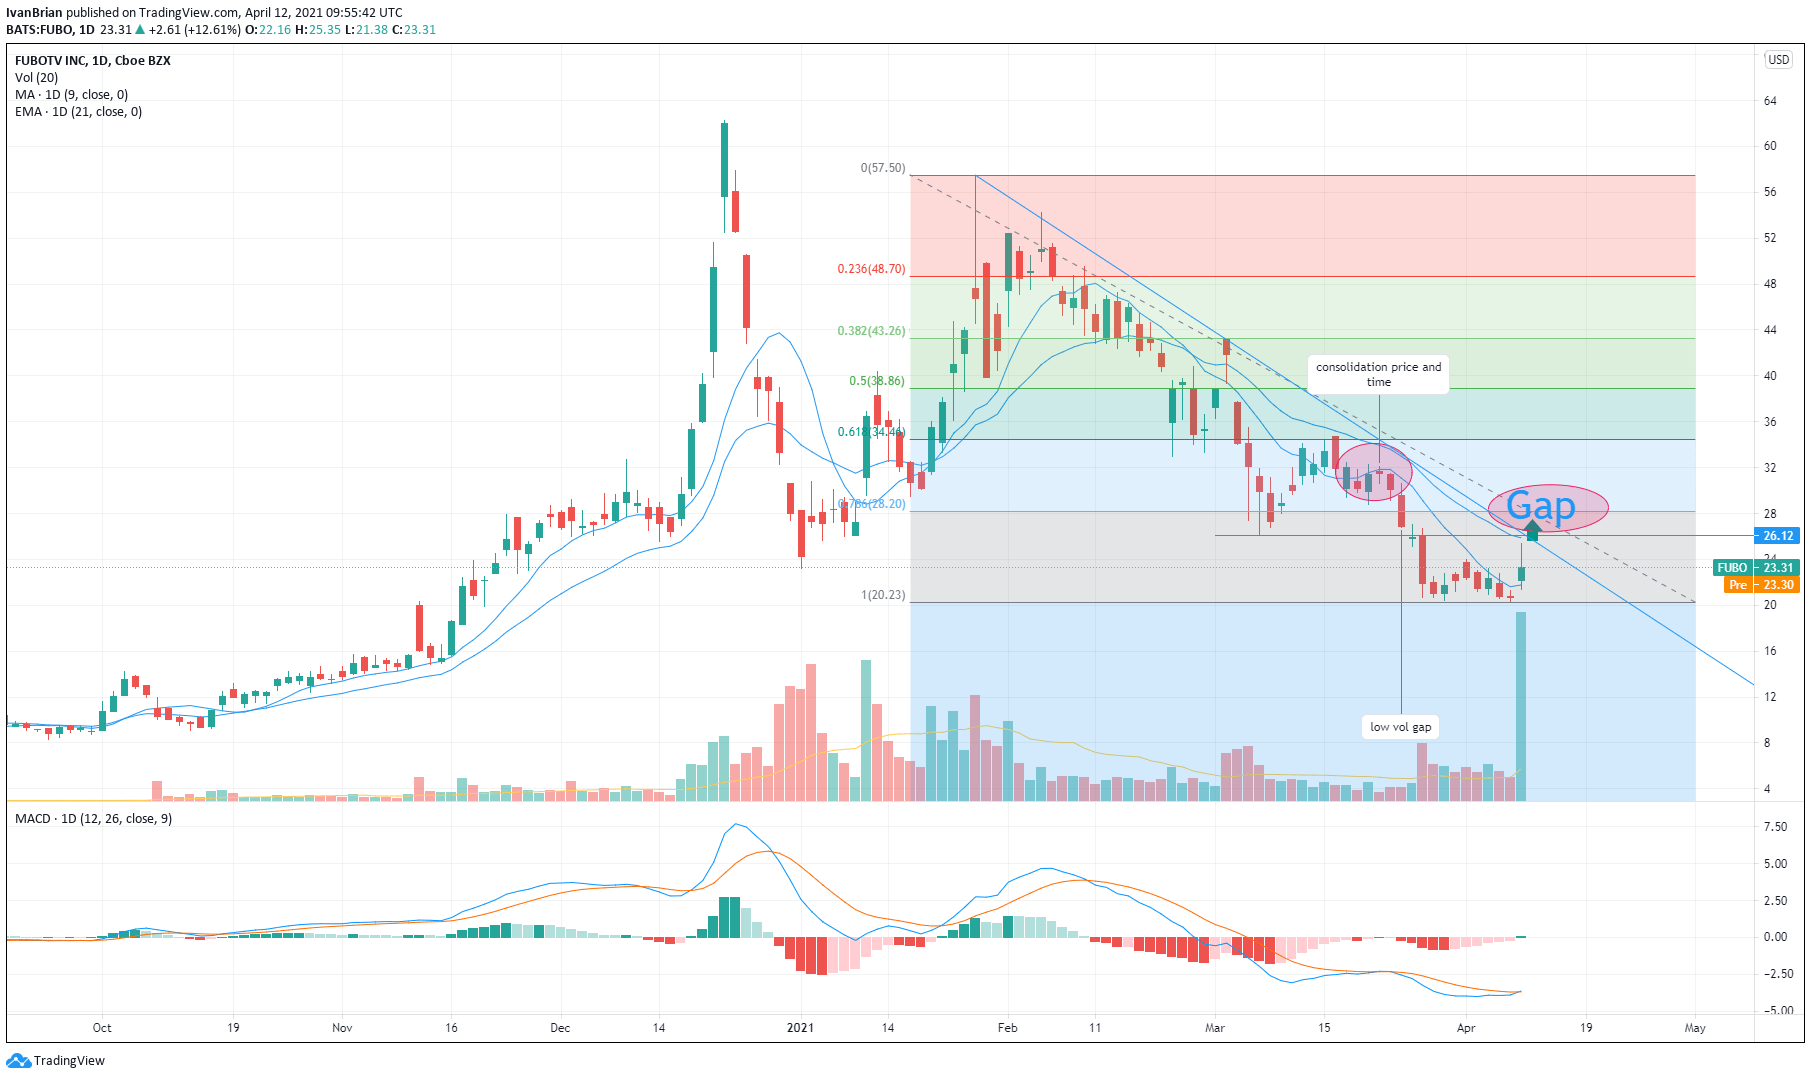
FUBO daily chart
The hourly chart gives a closer look at the MACD crossover.
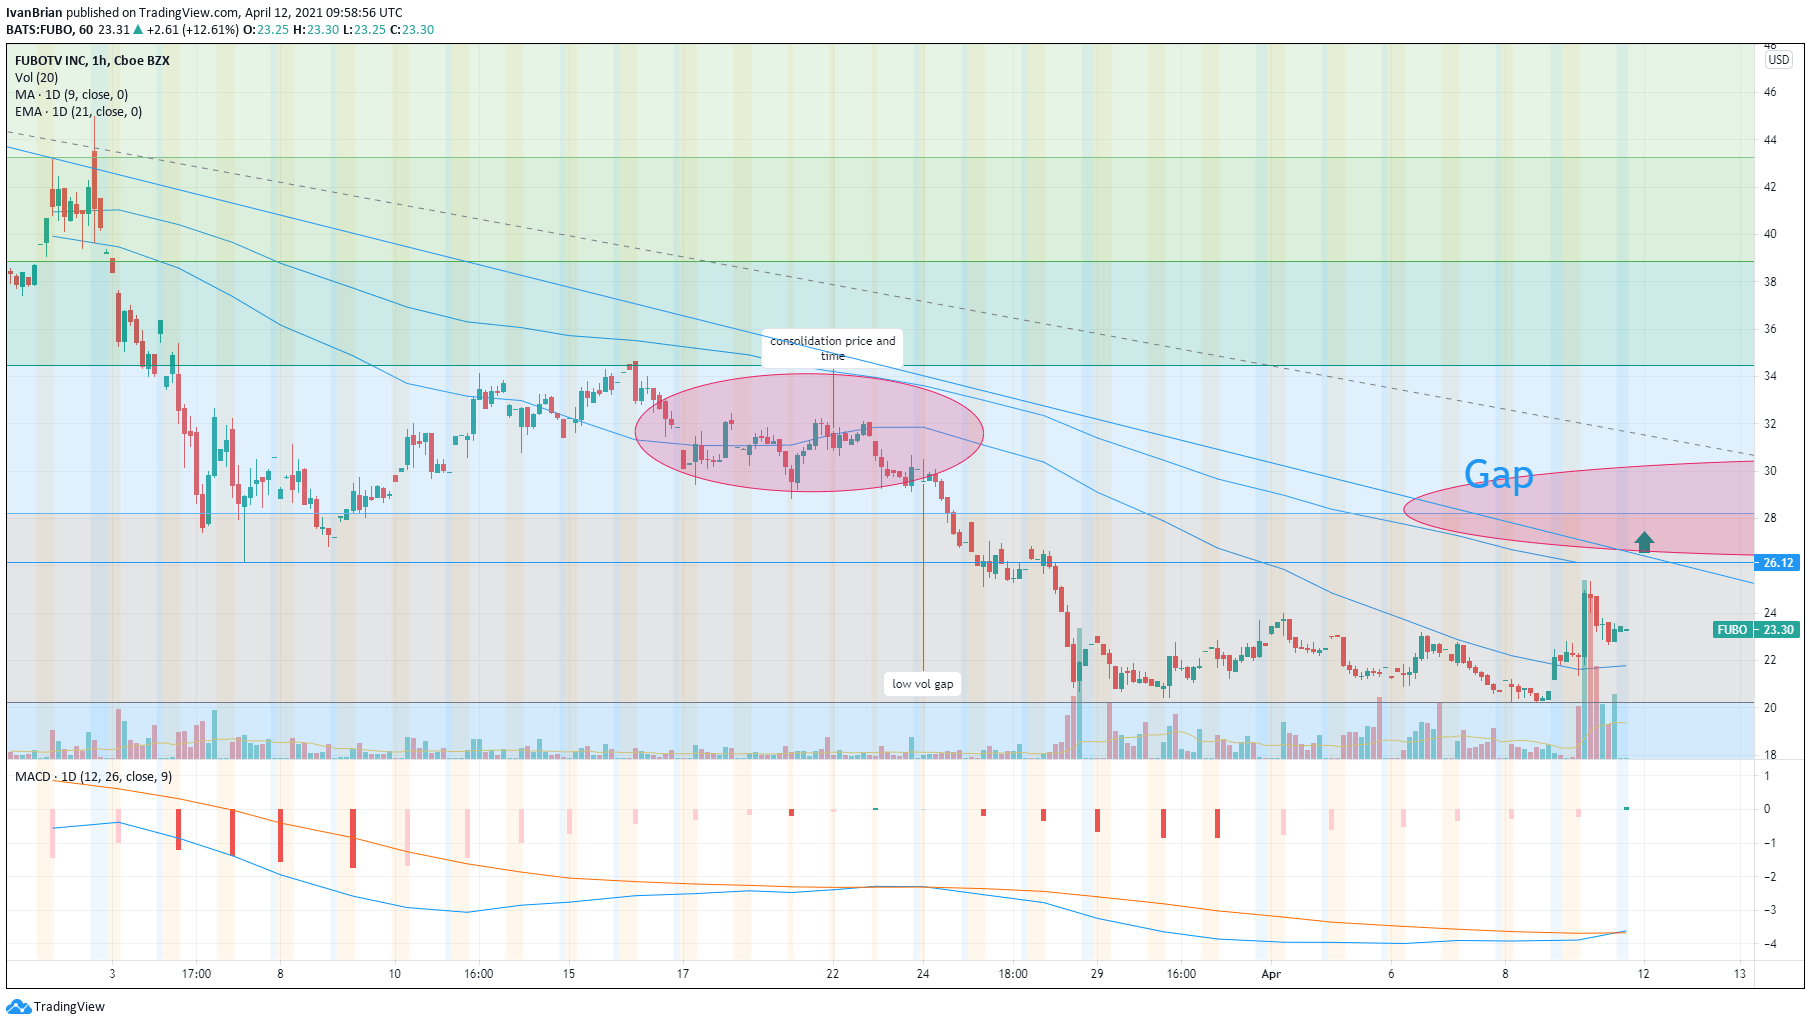
FUBO hourly chart
At the time of writing, the author has no position in any stock mentioned in this article and no business relationship with any company mentioned. The author has not received compensation for writing this article, other than from FXStreet.
This article is for information purposes only. The author and FXStreet are not registered investment advisors and nothing in this article is intended to be investment advice. It is important to perform your own research before making any investment and take independent advice from a registered investment advisor.
FXStreet and the author do not provide personalized recommendations. The author makes no representations as to accuracy, completeness, or the suitability of this information. FXStreet and the author will not be liable for any errors, omissions or any losses, injuries or damages arising from this information and its display or use. The author will not be held responsible for information that is found at the end of links posted on this page.
Errors and omissions excepted.
Information on these pages contains forward-looking statements that involve risks and uncertainties. Markets and instruments profiled on this page are for informational purposes only and should not in any way come across as a recommendation to buy or sell in these assets. You should do your own thorough research before making any investment decisions. FXStreet does not in any way guarantee that this information is free from mistakes, errors, or material misstatements. It also does not guarantee that this information is of a timely nature. Investing in Open Markets involves a great deal of risk, including the loss of all or a portion of your investment, as well as emotional distress. All risks, losses and costs associated with investing, including total loss of principal, are your responsibility. The views and opinions expressed in this article are those of the authors and do not necessarily reflect the official policy or position of FXStreet nor its advertisers. The author will not be held responsible for information that is found at the end of links posted on this page.
If not otherwise explicitly mentioned in the body of the article, at the time of writing, the author has no position in any stock mentioned in this article and no business relationship with any company mentioned. The author has not received compensation for writing this article, other than from FXStreet.
FXStreet and the author do not provide personalized recommendations. The author makes no representations as to the accuracy, completeness, or suitability of this information. FXStreet and the author will not be liable for any errors, omissions or any losses, injuries or damages arising from this information and its display or use. Errors and omissions excepted.
The author and FXStreet are not registered investment advisors and nothing in this article is intended to be investment advice.
Recommended content
Editors’ Picks

EUR/USD hits two-week tops near 1.0500 on poor US Retail Sales
The selling pressure continues to hurt the US Dollar and now encourages EUR/USD to advance to new two-week peaks in levels just shy of the 1.0500 barrier in the wake of disappointing results from US Retail Sales.

GBP/USD surpasses 1.2600 on weaker US Dollar
GBP/USD extends its march north and reclaims the 1.2600 hurdle for the first time since December on the back of the increasing downward bias in the Greenback, particularly exacerbated following disheartening US results.

Gold maintains the bid tone near $2,940
The continuation of the offered stance in the Greenback coupled with declining US yields across the board underpin the extra rebound in Gold prices, which trade at shouting distance from their record highs.

Weekly wrap: XRP, Solana and Dogecoin lead altcoin gains on Friday
XRP, Solana (SOL) and Dogecoin (DOGE) gained 5.91%, 2.88% and 3.36% respectively on Friday. While Bitcoin (BTC) hovers around the $97,000 level, the three altcoins pave the way for recovery and rally in altcoins ranking within the top 50 cryptocurrencies by market capitalization on CoinGecko.

Tariffs likely to impart a modest stagflationary hit to the economy this year
The economic policies of the Trump administration are starting to take shape. President Trump has already announced the imposition of tariffs on some of America's trading partners, and we assume there will be more levies, which will be matched by foreign retaliation, in the coming quarters.

The Best Brokers of the Year
SPONSORED Explore top-quality choices worldwide and locally. Compare key features like spreads, leverage, and platforms. Find the right broker for your needs, whether trading CFDs, Forex pairs like EUR/USD, or commodities like Gold.