FTSE 100 (UK) Index Elliott Wave technical analysis [Video]
![FTSE 100 (UK) Index Elliott Wave technical analysis [Video]](https://editorial.fxsstatic.com/images/i/Equity-Index_FTSE-2_XtraLarge.jpg)
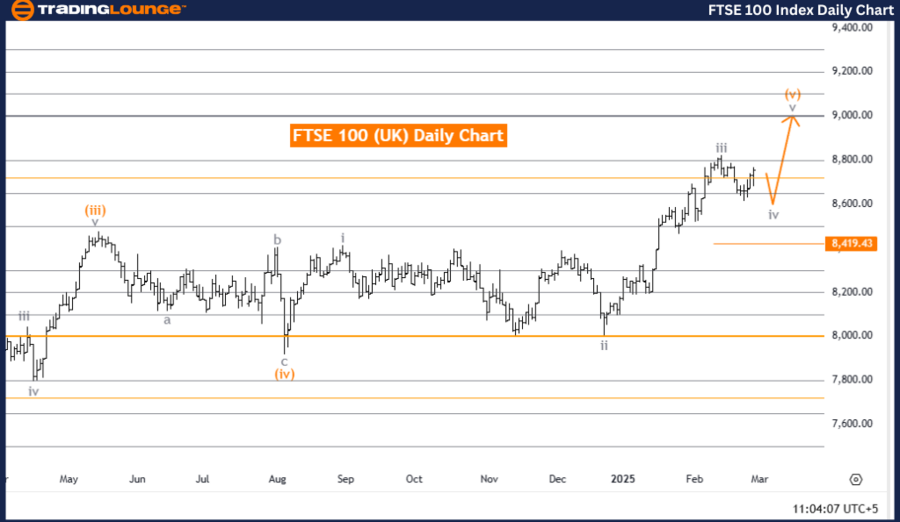
FTSE 100 (UK) Elliott Wave Analysis – Day Chart.
FTSE 100 (UK) Elliott Wave technical analysis
-
Function: Counter Trend.
-
Mode: Corrective.
-
Structure: Orange Wave 5.
-
Position: Navy Blue Wave 3.
-
Direction next lower degrees: Navy Blue Wave 4.
-
Wave cancel invalid level: 8,419.43.
Market overview
The FTSE 100 Elliott Wave Analysis for the day chart suggests a counter-trend correction, with the market currently in orange wave 5, forming part of a larger corrective structure within navy blue wave 3. This indicates an intermediate correction phase before resuming the broader trend. The next anticipated move is navy blue wave 4, expected after the completion of orange wave 5.
Wave progression
-
Orange wave 4 appears completed, with orange wave 5 now unfolding.
-
This corrective phase may involve sideways or upward movements before navy blue wave 4 begins.
-
The completion of orange wave 5 is crucial, as it may indicate the start of navy blue wave 4, a potential impulsive move in the direction of the larger trend.
Key level to monitor
-
Wave cancellation invalid level: 8,419.43
-
If the price moves above 8,419.43, it will invalidate the current wave count, requiring a reassessment of the market structure.
-
This level acts as key resistance, and a breakout above it may signal a trend shift.
Conclusion
The FTSE 100 is currently in a corrective phase within its Elliott Wave structure, with orange wave 5 in play following the completion of orange wave 4. This movement is part of navy blue wave 3, and the next significant move is anticipated to be navy blue wave 4.
Traders should closely monitor the completion of orange wave 5, as it will provide insight into the timing and direction of the upcoming wave. Understanding wave structures is essential for predicting market movements and aligning trading strategies effectively.
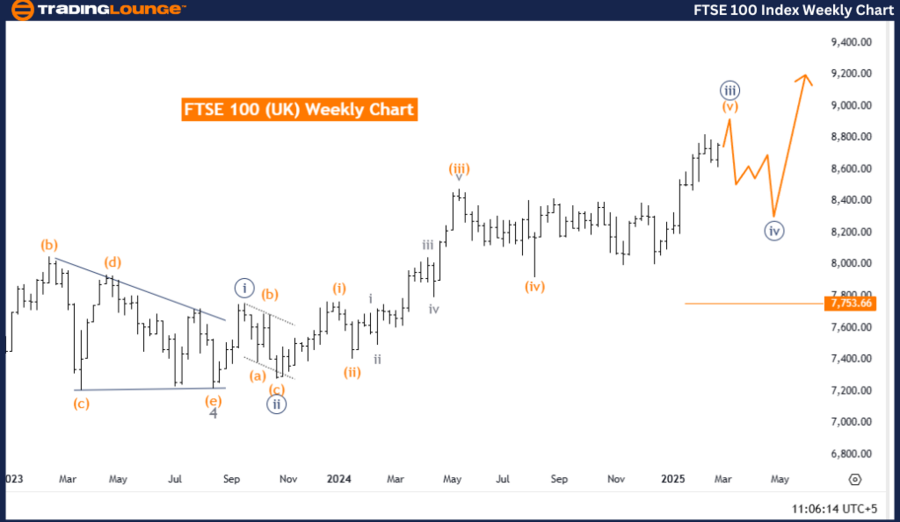
FTSE 100 (UK) Elliott Wave Analysis – Weekly Chart.
FTSE 100 (UK) Elliott Wave technical analysis
-
Function: Bullish Trend.
-
Mode: Impulsive.
-
Structure: Navy Blue Wave 3.
-
Position: Gray Wave 3.
-
Direction next lower degrees: Navy Blue Wave 4.
-
Wave cancel invalid level: 7,753.66.
Market overview
The FTSE 100 Elliott Wave Analysis for the weekly chart indicates a strong bullish trend, with the market currently in an impulsive phase. The wave structure is identified as navy blue wave 3, forming part of a larger upward movement within gray wave 3. This suggests continued upward momentum, characteristic of an impulsive wave. The next expected move is navy blue wave 4, which will likely bring a corrective phase after the completion of navy blue wave 3.
Wave progression
-
Navy blue wave 2 appears completed, with navy blue wave 3 now in progress.
-
Navy blue wave 3 is expected to continue its strong upward momentum, typical of impulsive trends.
-
Traders should closely watch the development of navy blue wave 3, as its completion may signal the start of navy blue wave 4, a corrective phase that could bring temporary pullbacks or consolidation before the broader bullish trend resumes.
Key level to monitor
-
Wave cancellation invalid level: 7,753.66
-
If the price falls below 7,753.66, the current wave count will be invalidated, requiring a reassessment of the market structure.
-
This level serves as a key support, and a breach could indicate a potential trend shift.
Conclusion
The FTSE 100 remains in a bullish trend, with navy blue wave 3 in play after the completion of navy blue wave 2. This impulsive move is part of gray wave 3, and the next anticipated phase is navy blue wave 4, which may introduce a corrective pullback before the trend resumes.
Traders should carefully monitor price action around the 7,753.66 level, as it serves as a key threshold for confirming the bullish outlook. Understanding wave structures is crucial for predicting market movements and aligning trading strategies effectively.
Technical analyst: Malik Awais.
FTSE 100 (UK) Elliott Wave technical analysis [Video]
Author

Peter Mathers
TradingLounge
Peter Mathers started actively trading in 1982. He began his career at Hoei and Shoin, a Japanese futures trading company.


