FTSE 100 (UK) Index Elliott Wave technical analysis [Video]
![FTSE 100 (UK) Index Elliott Wave technical analysis [Video]](https://editorial.fxsstatic.com/images/i/Equity-Index_FTSE-2_XtraLarge.jpg)
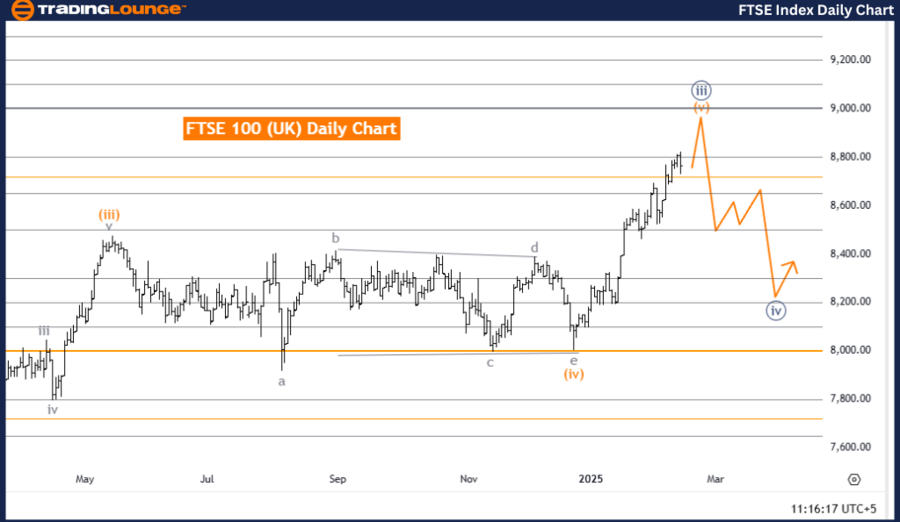
FTSE 100 (UK) Elliott Wave Analysis - Trading Lounge Daily Chart.
FTSE 100 (UK) Elliott Wave technical analysis
-
Function: Trend.
-
Mode: Impulsive.
-
Structure: Orange Wave 5.
-
Position: Navy Blue Wave 3.
-
Next lower degree direction: Navy Blue Wave 4.
Analysis details:
The FTSE 100 daily chart indicates a bullish trend with an impulsive wave structure. The market is currently in orange wave 5, following the completion of orange wave 4. This suggests that upward momentum remains strong, and the index is experiencing further gains.
The market is positioned in navy blue wave 3, indicating that the broader uptrend is still progressing. As orange wave 5 unfolds, the price is expected to continue moving upward before transitioning into the next corrective phase in navy blue wave 4.
The next lower-degree wave to monitor is navy blue wave 4, which will emerge once orange wave 5 completes. This suggests that after the ongoing upward movement, a short-term pullback or consolidation may occur before the bullish trend resumes.
Conclusion:
The FTSE 100 daily chart maintains a strong bullish trend, with orange wave 5 currently in play. The next phase in the Elliott Wave sequence will be navy blue wave 4, which may introduce a temporary downward correction before the uptrend continues. As long as the current wave structure remains intact, further gains are anticipated in the longer term.
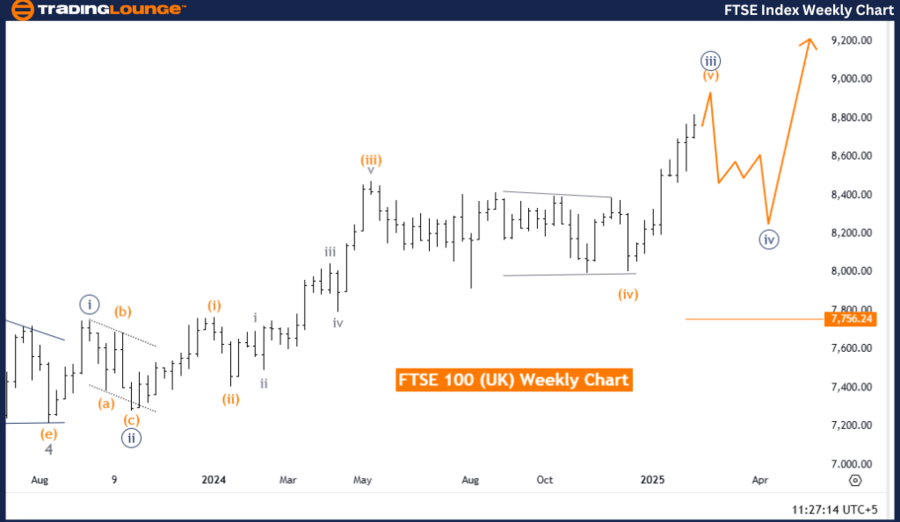
FTSE 100 (UK) Elliott Wave Analysis - Trading Lounge Weekly Chart.
FTSE 100 (UK) Elliott Wave technical analysis
-
Function: Trend.
-
Mode: Impulsive.
-
Structure: Orange Wave 5.
-
Position: Navy Blue Wave 3.
-
Next lower degree direction: Navy Blue Wave 4.
-
Invalidation level: 7,756.24.
Analysis details:
The FTSE 100 weekly chart indicates a bullish trend with an impulsive wave structure. The market is currently in orange wave 5, following the completion of orange wave 4. This suggests that upward momentum remains strong, and the index is experiencing further gains.
The market is positioned in navy blue wave 3, confirming that the broader uptrend is still progressing. As orange wave 5 unfolds, the price is expected to continue moving upward before transitioning into the next corrective phase in navy blue wave 4.
The next lower-degree wave to monitor is navy blue wave 4, which will emerge once orange wave 5 completes. This suggests that after the ongoing upward movement, a short-term pullback or consolidation may occur before the bullish trend resumes.
The invalidation level for this Elliott Wave structure is 7,756.24. If the price drops below this level, the current wave count would be invalidated, requiring a reassessment of the trend. However, as long as the price remains above 7,756.24, the bullish outlook remains valid, and further gains are expected in the long term.
Conclusion:
The FTSE 100 weekly chart maintains a strong bullish trend, with orange wave 5 currently in play. The next phase in the Elliott Wave sequence will be navy blue wave 4, which may introduce a temporary downward correction before the uptrend continues. As long as the current wave structure remains intact, further long-term gains are anticipated.
Technical analyst: Malik Awais.
FTSE 100 (UK) Elliott Wave technical analysis [Video]
Author

Peter Mathers
TradingLounge
Peter Mathers started actively trading in 1982. He began his career at Hoei and Shoin, a Japanese futures trading company.


