FTSE 100 (UK) index Elliott Wave technical analysis [Video]
![FTSE 100 (UK) index Elliott Wave technical analysis [Video]](https://editorial.fxstreet.com/images/Markets/Equities/FTSE/close-up-of-apple-iphone-screen-with-stock-exchange-16817528_XtraLarge.jpg)
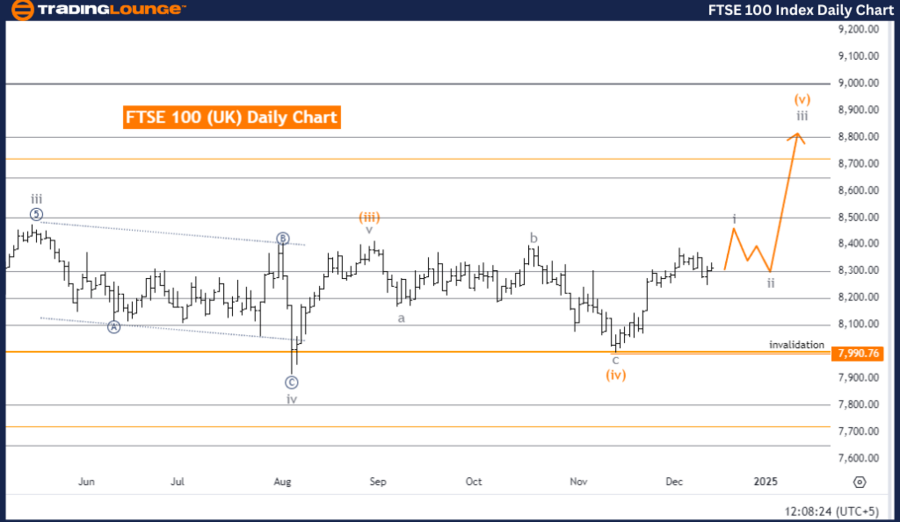
FTSE 100 Elliott Wave Analysis Trading Lounge Day Chart.
Index: FTSE 100 (UK).
Elliott Wave technical analysis
-
Function: Trend.
-
Mode: Impulsive.
-
Structure: Gray Wave 1.
-
Position: Orange Wave 5.
-
Direction for next lower degrees: Gray Wave 2.
Details
-
Current Status:
-
Orange wave 4 appears completed.
-
Gray wave 1 of orange wave 5 is actively in progress.
-
-
Invalidation Level: 7,990.76 (A drop below this level invalidates the current Elliott Wave structure).
Analysis overview
The FTSE 100 daily chart reflects a bullish trend, analyzed using Elliott Wave principles. The impulsive mode signals robust upward momentum in the ongoing wave structure.
Key highlights:
-
Wave Progression:
-
Orange wave 4 is complete, giving way to gray wave 1 of orange wave 5.
-
Gray wave 1 represents the start of a new impulsive sequence, building on prior momentum.
-
-
Upward Momentum:
-
Gray wave 1 continues to guide prices higher, supported by bullish sentiment.
-
-
Upcoming Correction:
-
Following gray wave 1, gray wave 2 is expected to introduce a corrective phase.
-
Key considerations
-
Bullish Sentiment:
The completion of orange wave 4 and the progression of gray wave 1 within orange wave 5 signify strong upward movement. -
Potential Reassessment:
If prices fall below 7,990.76, the current Elliott Wave count becomes invalid, necessitating a new analysis.
Strategic implications for traders
-
Capitalizing on the Trend:
Traders and analysts should align their strategies with the bullish momentum of gray wave 1 within orange wave 5. -
Preparing for Gray Wave 2:
Anticipating the potential corrective phase will help in managing positions effectively. -
Monitoring Progression:
Close observation of price movements and wave development is critical for informed decision-making.
This analysis underscores a strong bullish outlook for the FTSE 100 on the daily chart. The current phase, driven by gray wave 1, offers opportunities for traders to capitalize on the prevailing upward momentum.
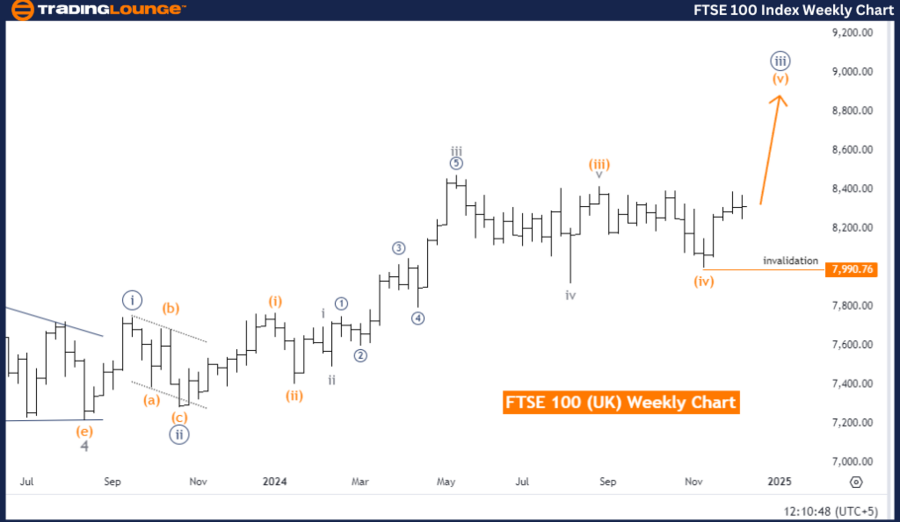
FTSE 100 Elliott Wave Analysis Trading Lounge Weekly Chart.
Index: FTSE 100 (UK).
Elliott Wave technical analysis
-
Function: Trend.
-
Mode: Impulsive.
-
Structure: Orange Wave 5.
-
Position: Navy Blue Wave 3.
-
Direction for next lower degrees: Navy Blue Wave 4.
Details
-
Current Status:
-
Orange wave 4 is complete.
-
Orange wave 5 is actively progressing within navy blue wave 3.
-
-
Invalidation Level: 7,990.76 (A drop below this level invalidates the current Elliott Wave structure).
Analysis overview
The FTSE 100 weekly chart reflects a bullish trend, supported by Elliott Wave analysis. The impulsive mode signals strong and sustained upward movement in the current wave structure.
Key highlights:
-
Wave Progression:
-
Orange wave 4 has transitioned into orange wave 5, marking the final phase of the ongoing impulsive sequence.
-
The market is currently positioned within navy blue wave 3, reinforcing the bullish momentum.
-
-
Final Impulsive Phase:
-
Orange wave 5 often represents the peak of the upward trend, indicating a culmination of the bullish sequence.
-
-
Upcoming Correction:
-
Following orange wave 5 and navy blue wave 3, a corrective phase in navy blue wave 4 is anticipated.
-
Key considerations
-
Bullish Sentiment:
The progression of orange wave 5 within navy blue wave 3 signifies sustained upward momentum. -
Potential Reassessment:
If prices drop below 7,990.76, the current wave count becomes invalid, requiring a reevaluation.
Strategic implications for traders
-
Trend-Following Opportunities:
Orange wave 5 offers opportunities to align with the bullish momentum in this phase of the market. -
Preparing for Navy Blue Wave 4:
Anticipating the corrective phase following the peak of navy blue wave 3 is key to managing risk effectively. -
Monitoring Progression:
Close observation of price action and wave development is essential for informed decision-making.
This analysis highlights a strong bullish outlook for the FTSE 100 weekly chart. The current phase, driven by orange wave 5, supports strategies that capitalize on the ongoing upward momentum while preparing for eventual corrective moves.
Technical analyst: Malik Awais.
Elliott Wave technical analysis [Video]
Author

Peter Mathers
TradingLounge
Peter Mathers started actively trading in 1982. He began his career at Hoei and Shoin, a Japanese futures trading company.


