FTSE 100 (UK) Index Elliott Wave technical analysis [Video]
![FTSE 100 (UK) Index Elliott Wave technical analysis [Video]](https://editorial.fxstreet.com/images/Markets/Equities/FTSE/ftse-100-index-17327640_XtraLarge.jpg)
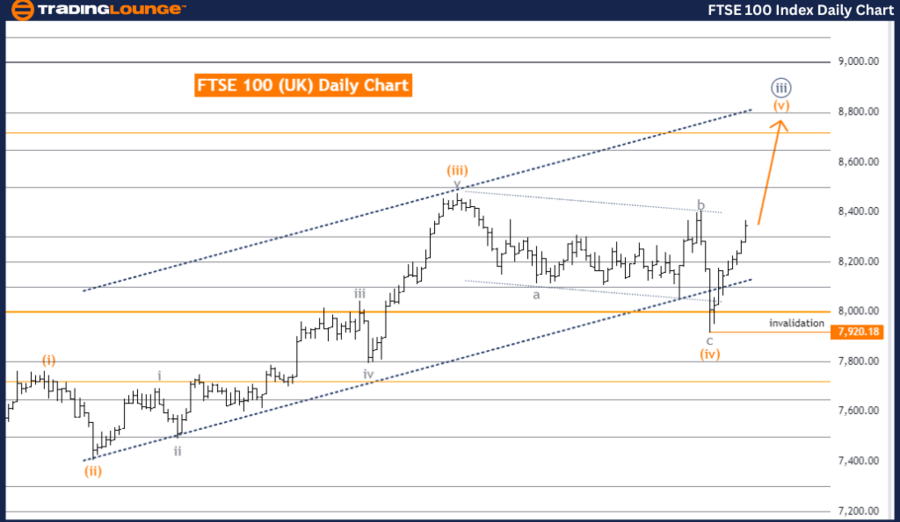
FTSE 100 (UK) Elliott Wave Analysis Trading Lounge Day Chart
FTSE 100 (UK) Elliott Wave technical analysis
Function: Trend.
Mode: Impulsive.
Structure: Orange Wave 5.
Position: Navy Blue Wave 3.
Direction next lower degrees: Navy Blue Wave 4.
Details: Orange Wave 4 appears to be completed. Now, Orange Wave 5 of Navy Blue Wave 3 is underway. Wave Cancel Invalid Level: 7,920.18.
The FTSE 100 day chart, analyzed using Elliott Wave theory, shows the market in a trending mode with an impulsive structure. The focus is on Orange Wave 5, indicating a strong upward momentum within this wave. This Orange Wave 5 is part of the broader Navy Blue Wave 3, reflecting the ongoing bullish trend in this larger wave.
At this juncture, Orange Wave 4, typically a corrective phase within the wave sequence, is considered complete. With the conclusion of Orange Wave 4, the analysis suggests the commencement of Orange Wave 5, continuing the upward movement as part of Navy Blue Wave 3. This scenario implies further price increases as the impulsive nature of Wave 5 propels the market higher.
The next lower degree in the wave sequence points to Navy Blue Wave 4, which is likely to follow the completion of Orange Wave 5. Navy Blue Wave 4 generally introduces a corrective phase within the overall trend before the market resumes its upward trajectory in the subsequent wave.
The wave cancel invalid level is set at 7,920.18. This level is critical in the context of this Elliott Wave analysis. If the market drops below this level, it would invalidate the current wave count, suggesting a possible alteration in the wave structure or a change in the market's trend direction.
In summary, the FTSE 100 day chart is in a strong upward trend, currently within Orange Wave 5 of Navy Blue Wave 3. With Orange Wave 4 completed, the market is anticipated to continue rising in the impulsive Orange Wave 5. The crucial invalidation level is at 7,920.18, essential for confirming the continuation of the current wave analysis.
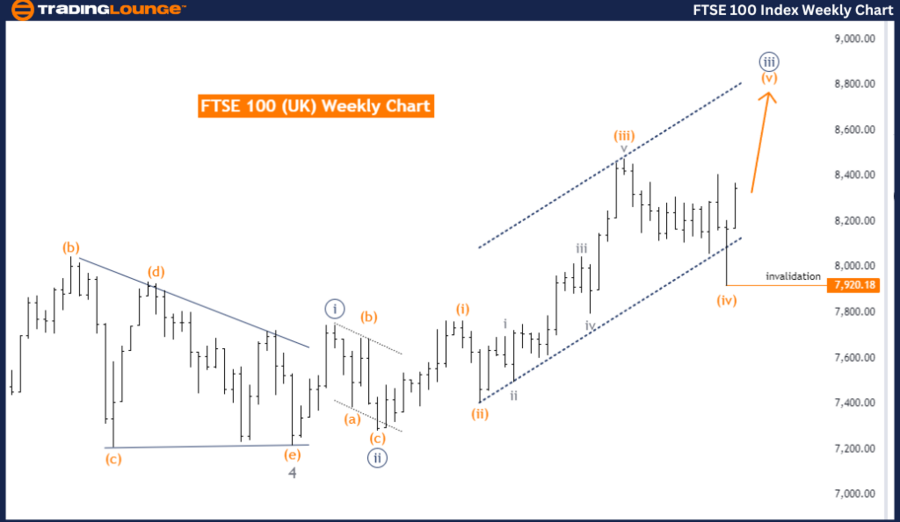
FTSE 100 (UK) Elliott Wave Analysis Trading Lounge Weekly Chart
FTSE 100 (UK) Elliott Wave technical analysis
Function: Trend.
Mode: Impulsive.
Structure: Orange Wave 5.
Position: Navy Blue Wave 3.
Direction next lower degrees: Navy Blue Wave 4.
Details: Orange Wave 4 appears to be completed. Now, Orange Wave 5 of Navy Blue Wave 3 is in progress. Wave Cancel Invalid Level: 7,920.18
The FTSE 100 weekly chart, analyzed using Elliott Wave theory, is currently exhibiting a strong upward trend characterized by an impulsive wave structure. The wave under focus is Orange Wave 5, signaling continued bullish momentum within this phase. This Orange Wave 5 is part of the broader Navy Blue Wave 3, suggesting a sustained upward movement in the market.
Orange Wave 4, typically a corrective phase in the wave sequence, seems to have completed. Following this, Orange Wave 5 has now commenced, indicating that the market continues its upward trajectory as part of Navy Blue Wave 3. This ongoing bullish trend is expected to propel the market higher as Orange Wave 5 progresses.
The next wave to monitor in the lower degree is Navy Blue Wave 4, likely to occur after Orange Wave 5 concludes. Navy Blue Wave 4 is generally a corrective wave, which means the market might experience a temporary pullback or consolidation phase before resuming its overall upward trend.
A critical aspect of this analysis is the wave cancel invalid level set at 7,920.18. This level is crucial because if the market drops below it, the current Elliott Wave count would be invalidated. Such a scenario could suggest a potential change in the wave structure or a shift in the market's overall trend direction.
In summary, the FTSE 100 weekly chart is in a strong uptrend, currently within Orange Wave 5 of Navy Blue Wave 3. With Orange Wave 4 completed, the market is expected to continue rising as Orange Wave 5 progresses. The key level to monitor is 7,920.18, which serves as the invalidation point for the current wave analysis.
Technical analyst: Malik Awais.
FTSE 100 (UK) Elliott Wave technical analysis [Video]
Author

Peter Mathers
TradingLounge
Peter Mathers started actively trading in 1982. He began his career at Hoei and Shoin, a Japanese futures trading company.


