FTSE 100 (UK) Index Elliott Wave technical analysis [Video]
![FTSE 100 (UK) Index Elliott Wave technical analysis [Video]](https://editorial.fxstreet.com/images/Markets/Equities/FTSE/ftse-100-index-17327640_XtraLarge.jpg)
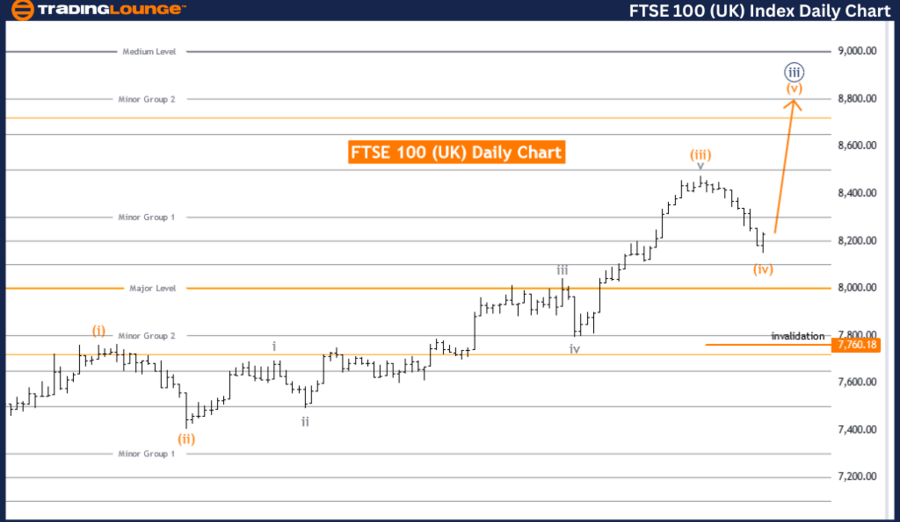
FTSE 100 (UK) Elliott Wave Analysis Trading Lounge Day Chart.
FTSE 100 (UK) Elliott Wave technical analysis
Function: Trend.
Mode: Impulsive.
Structure: Orange wave 5.
Position: Navy blue wave 3.
Direction next lower degrees: Navy blue wave 4.
Details: Orange wave 4 looking completed. Now orange wave 5 of navy blue wave 3 is in play.
Wave cancel invalid level: 7760.18.
The FTSE 100 Elliott Wave Analysis for the day chart offers a detailed examination of the current market trend using Elliott Wave Theory. This analysis is primarily concerned with identifying and predicting the direction and stages of the market trend. The function identified in this analysis is trend, indicating that the market is following a clear directional path rather than experiencing sideways movement or correction.
The mode of the trend is described as impulsive, which means the market is experiencing a strong and sustained movement in one direction, typically indicative of bullish or bearish momentum. The specific wave structure being analyzed is orange wave 5, which forms part of a larger wave sequence known as navy blue wave 3. This positioning within the wave structure suggests that the market is in an advanced stage of an upward trend.
Currently, the market is positioned within navy blue wave 3, and the analysis indicates that orange wave 4 has been completed. This completion signifies the end of a corrective phase within the broader upward trend. Following this, the market is now in the phase of orange wave 5, which is part of navy blue wave 3. The initiation of orange wave 5 typically marks a continuation of the strong upward movement, suggesting further bullish momentum.
The direction for the next lower degrees points towards navy blue wave 4, which implies that once orange wave 5 completes, the market may enter a corrective phase corresponding to navy blue wave 4. This subsequent wave will likely result in a temporary pullback or consolidation before resuming the overall trend.
A critical detail in this analysis is the wave cancel invalid level set at 7760.18. This level acts as a threshold that, if breached, would invalidate the current wave count, necessitating a reevaluation of the wave structure. Maintaining the market above this level is essential for the current Elliott Wave count to remain valid and for the anticipated trends to play out as expected.
In summary, the FTSE 100 Elliott Wave Analysis on the day chart shows a strong, impulsive trend within orange wave 5 of navy blue wave 3. With the completion of orange wave 4, the market is now expected to continue its upward momentum. The wave cancel invalid level at 7760.18 is a crucial marker for maintaining the validity of this wave count, guiding traders in their strategic decision-making based on Elliott Wave Theory principles.
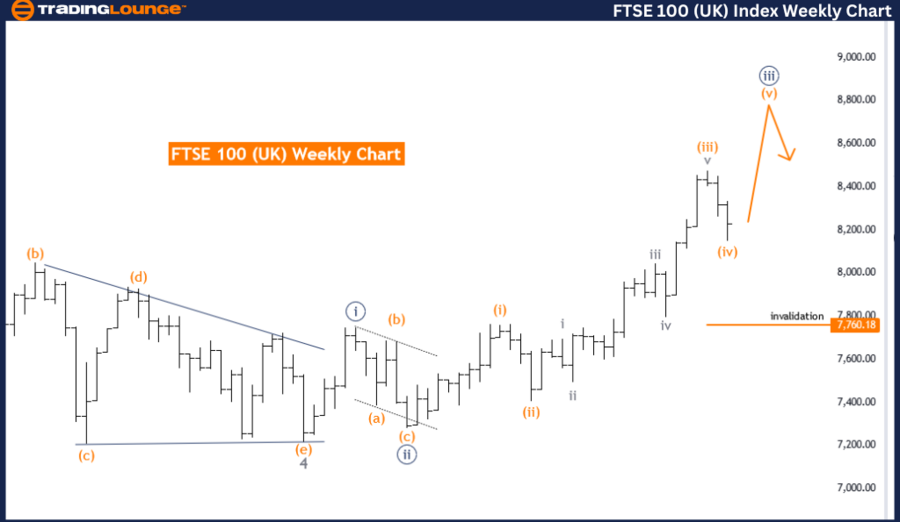
FTSE 100 (UK) Elliott Wave technical analysis weekly chart
Function: Trend.
Mode: Impulsive.
Structure: Orange wave 5.
Position: Navy blue wave 3.
Direction next lower degrees: Navy blue wave 4.
Details: Orange wave 4 looking completed. Now orange wave 5 of navy blue wave 3 is in play.
Wave cancel invalid level: 7760.18
The FTSE 100 Elliott Wave Analysis for the weekly chart provides an in-depth look at the market's current trend using the Elliott Wave Theory, which helps in identifying and predicting market movements. This analysis indicates that the function of the market trend is to follow a clear directional path, with the mode being impulsive. An impulsive mode suggests a strong and sustained movement in one direction, indicating a robust market trend.
The specific wave structure under analysis is orange wave 5, which is a part of a larger wave sequence identified as navy blue wave 3. This positioning indicates that the market is in an advanced stage of an upward trend within the larger context of navy blue wave 3. The completion of orange wave 4 has been observed, signaling the end of a corrective phase within the ongoing upward trend. Consequently, the market is now in the phase of orange wave 5, which is part of navy blue wave 3. This phase typically continues the strong upward movement, suggesting further bullish momentum in the market.
The direction for the next lower degrees points towards navy blue wave 4, implying that once orange wave 5 completes, the market may enter a corrective phase corresponding to navy blue wave 4. This anticipated corrective phase might lead to a temporary pullback or consolidation before the market resumes its overall upward trend.
A critical detail in this analysis is the wave cancel invalid level set at 7760.18. This level serves as a threshold that, if breached, would invalidate the current wave count, requiring a reevaluation of the wave structure. It is crucial for the market to stay above this level to maintain the validity of the current Elliott Wave count and for the expected trends to unfold as predicted.
In summary, the FTSE 100 Elliott Wave Analysis on the weekly chart shows a strong, impulsive trend within orange wave 5 of navy blue wave 3. With the completion of orange wave 4, the market is anticipated to continue its upward momentum. The wave cancel invalid level at 7760.18 is essential for maintaining the current wave count's validity, guiding traders in their strategic decisions based on the principles of Elliott Wave Theory.
FTSE 100 (UK) Index Elliott Wave technical analysis [Video]
Author

Peter Mathers
TradingLounge
Peter Mathers started actively trading in 1982. He began his career at Hoei and Shoin, a Japanese futures trading company.


