FTSE 100 (UK) Elliott Wave technical analysis [Video]
![FTSE 100 (UK) Elliott Wave technical analysis [Video]](https://editorial.fxsstatic.com/images/i/Equity-Index_FTSE-1_XtraLarge.jpg)
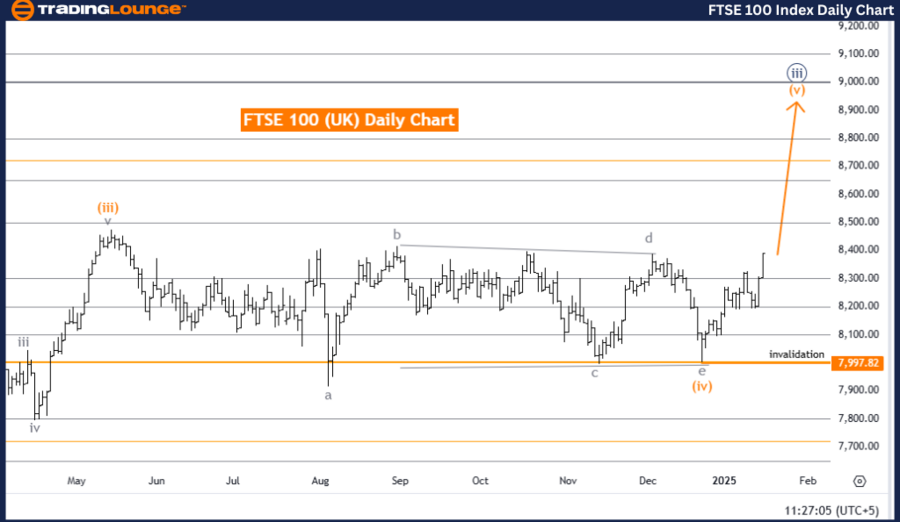
FTSE 100 (UK) Elliott Wave Analysis - Trading Lounge Day Chart
FTSE 100 (UK) Elliott Wave technical analysis
-
Function: Bullish Trend.
-
Mode: Impulsive.
-
Structure: Orange wave 5.
-
Position: Navy blue wave 3.
-
Direction (next lower degrees): Navy blue wave 4.
Details
The FTSE 100 daily chart demonstrates a bullish trend according to Elliott Wave Analysis. The wave mode is impulsive, with a focus on orange wave five, driving the ongoing upward momentum within the larger bullish structure. This wave forms part of navy blue wave three, which represents the broader market's advancement.
The corrective phase of orange wave four appears complete, paving the way for orange wave five to extend the upward movement. This development aligns with navy blue wave three, indicating a strong impulsive phase driving the market toward the next stages of the bullish trend.
The focus is now on the completion of orange wave five, a crucial component in sustaining the bullish trend. The analysis highlights an invalidation level at 7,997.82. If the price drops below this threshold, the current wave structure will be invalidated, requiring a reevaluation of the wave count and overall trend direction. However, as long as the price remains above this level, the impulsive wave structure remains intact, supporting continued upward movement.
Conclusion
The FTSE 100 daily chart reflects a bullish outlook, with orange wave five unfolding following the completion of orange wave four. The market is progressing within navy blue wave three, confirming the impulsive nature of the current trend. Maintaining the price above the invalidation level of 7,997.82 is critical to validate the ongoing bullish structure.
This analysis underscores the importance of monitoring orange wave five’s development, as the market remains positioned for further gains as the wave unfolds.
FTSE 100 (UK) Elliott Wave technical analysis
-
Function: Bullish Trend.
-
Mode: Impulsive.
-
Structure: Orange wave 5.
-
Position: Navy blue wave 3.
-
Direction (next lower degrees): Navy blue wave 4.
Details
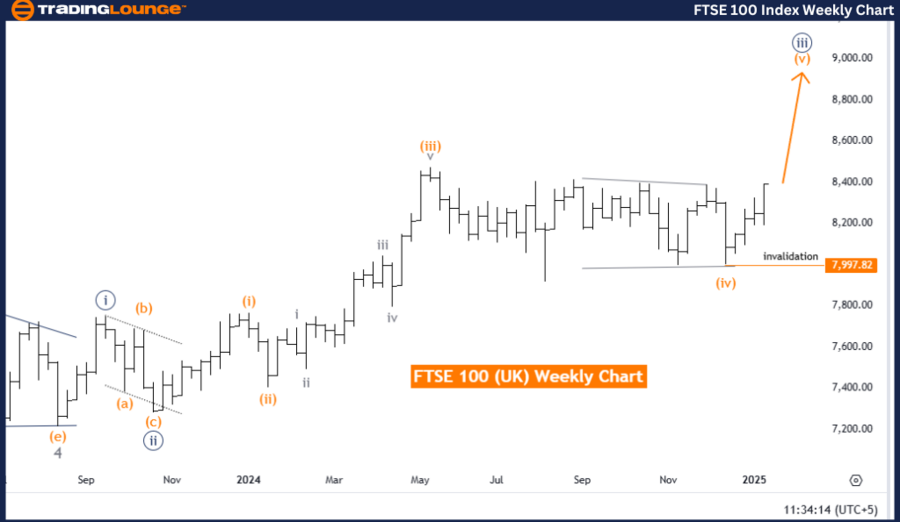
The FTSE 100 weekly chart reflects a bullish trend based on Elliott Wave Analysis. The market is advancing in an impulsive mode, driven by orange wave five, which is part of the larger navy blue wave three structure. This highlights a strong upward phase, supported by sustained bullish momentum.
The corrective phase of orange wave four appears to have concluded, paving the way for the development of orange wave five. This marks a continuation of the upward trajectory within navy blue wave three, reinforcing the bullish sentiment. The progression of orange wave five is expected to drive further gains as the wave unfolds.
An invalidation level is set at 7,997.82. If the price moves below this threshold, the current wave structure will no longer be valid, necessitating a reevaluation of the Elliott Wave count. However, as long as the price remains above this level, the bullish scenario remains intact, supporting continued upward movement.
Summary
The FTSE 100 weekly chart projects a bullish outlook, with orange wave five actively developing following the completion of orange wave four. This movement forms part of the broader navy blue wave three structure, signaling sustained upward momentum.
The invalidation level of 7,997.82 acts as a critical benchmark for maintaining the integrity of the bullish Elliott Wave pattern. As long as the market remains above this level, the trend is poised for further gains, showcasing a robust and ongoing bullish phase.
FTSE 100 (UK) Elliott Wave technical analysis [Video]
Author

Peter Mathers
TradingLounge
Peter Mathers started actively trading in 1982. He began his career at Hoei and Shoin, a Japanese futures trading company.


