FTSE 100 (UK) Elliott Wave technical analysis [Video]
![FTSE 100 (UK) Elliott Wave technical analysis [Video]](https://editorial.fxstreet.com/images/Markets/Equities/FTSE/close-up-of-apple-iphone-screen-with-stock-exchange-16817528_XtraLarge.jpg)
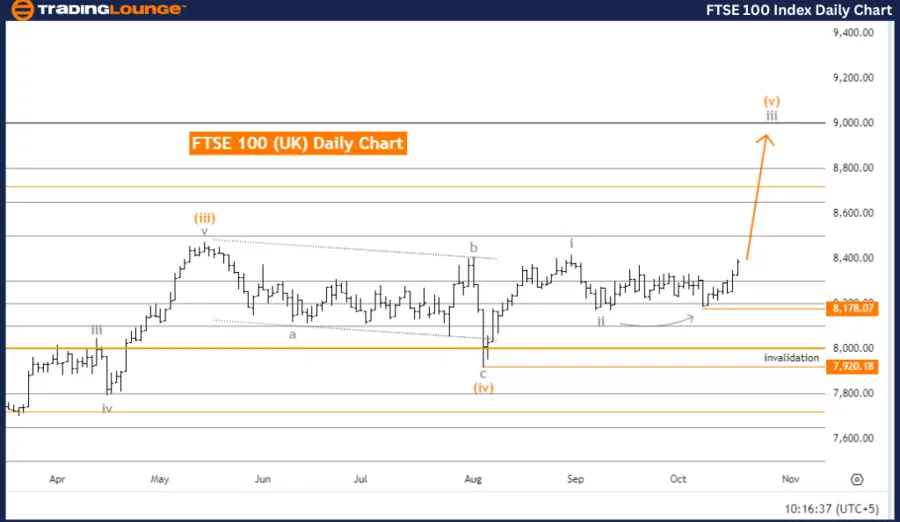
FTSE 100 Elliott Wave Analysis - Trading Lounge day chart.
FTSE 100 (UK) Elliott Wave technical analysis
Function: Bullish Trend.
Mode: Impulsive.
Structure: Gray wave 3.
Position: Orange wave 5.
Direction next higher degrees: Gray wave 3 (continue).
Details: Gray wave 2 is completed. Now gray wave 3 is in play.
Wave cancel invalidation level: 8,178.07.
The FTSE 100 Elliott Wave analysis on the day chart suggests a bullish trend, characterized by an impulsive mode that reflects strong upward momentum. The primary structure in focus is gray wave 3, part of the ongoing upward trend.
Currently, the market is positioned within orange wave 5 of gray wave 3, indicating that the market is advancing in the final phase of this wave sequence. The analysis shows that gray wave 2 has been completed, and now gray wave 3 is actively pushing the market higher.
The next expected phase is the continuation of gray wave 3, pointing to further upward movement in the near term. This phase will likely continue driving the market upward until a corrective phase begins. The wave structure follows the typical Elliott Wave pattern, where impulsive waves drive the market higher, and corrective waves provide brief pullbacks.
The analysis also sets a wave cancellation or invalidation level at 8,178.07. If the market falls below this level, the current Elliott Wave count will be invalidated, necessitating a reassessment of the wave structure. However, as long as the price remains above this threshold, the bullish trend in gray wave 3 is expected to continue.
Summary
-
The FTSE 100 is in a strong bullish phase, with gray wave 3 progressing upward.
-
Orange wave 5 is in play, driving further upward momentum.
-
The invalidation level is set at 8,178.07, with the trend expected to remain intact unless breached.
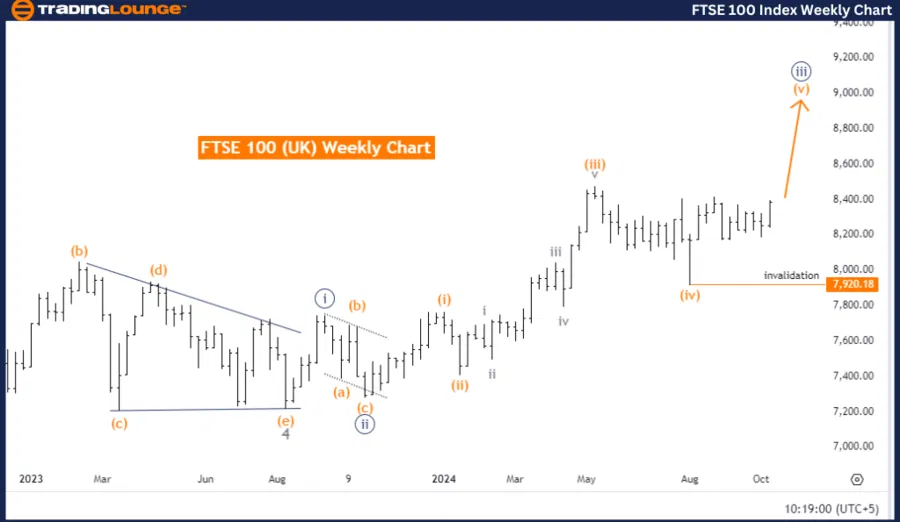
FTSE 100 Elliott Wave Analysis - Trading Lounge weekly chart.
FTSE 100 (UK) Elliott Wave technical analysis
Function: Bullish Trend.
Mode: Impulsive.
Structure: Orange wave 5.
Position: Navy blue wave 3.
Direction next higher degrees: Orange wave 5 (continue).
Details: Orange wave 4 is completed. Now orange wave 5 is in play.
Wave cancellation invalidation level: 7,920.18.
The FTSE 100 weekly Elliott Wave analysis indicates that the market is currently following a bullish trend with an impulsive mode, suggesting strong upward momentum. The primary wave structure under focus is orange wave 5, which is part of the larger bullish wave sequence. The market is positioned in navy blue wave 3, indicating the continuation of this bullish trend.
Orange wave 4 has been completed, and the market has now entered the next phase: orange wave 5. This wave signifies the continuation of the upward trend, with further gains expected as wave 5 progresses.
The analysis highlights that orange wave 5 is actively in play, representing the final leg of this particular wave sequence. As long as the price follows the current wave structure, further upward movement is anticipated. The bullish trend is expected to persist unless the key wave cancellation level is breached. The invalidation level is set at 7,920.18, meaning if the price falls below this level, the current Elliott Wave count would be invalidated, and the market analysis would need to be reassessed.
Summary
-
The FTSE 100 is in a bullish phase, with orange wave 5 in progress, signaling ongoing upward movement.
-
Orange wave 4 is completed, and the market has resumed its bullish trend.
-
The invalidation level is at 7,920.18, with the trend expected to continue unless this level is breached.
FTSE 100 (UK) Elliott Wave technical analysis [Video]
Author

Peter Mathers
TradingLounge
Peter Mathers started actively trading in 1982. He began his career at Hoei and Shoin, a Japanese futures trading company.


