FTSE 100 (UK) Elliott Wave technical analysis [Video]
![FTSE 100 (UK) Elliott Wave technical analysis [Video]](https://editorial.fxstreet.com/images/Markets/Equities/FTSE/british-money-and-stock-exchange-graph-17512709_XtraLarge.jpg)
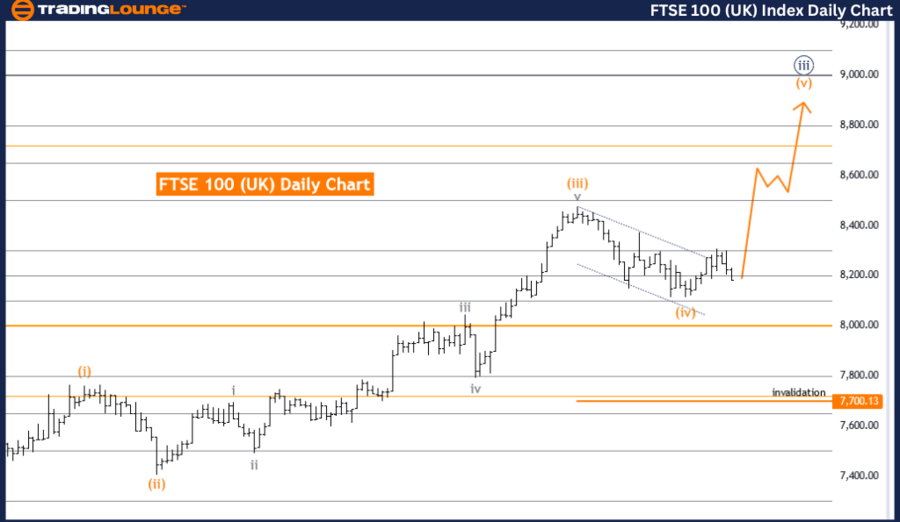
FTSE 100 (UK) Elliott Wave Analysis Trading Lounge Day Chart.
FTSE 100 (UK) Elliott Wave technical analysis
Function: Trend.
Mode: Impulsive.
Structure: Orange Wave 5.
Position: Navy Blue Wave 3.
Direction next lower degrees: Navy Blue Wave 4.
Details: Orange wave 4 looking completed. Now orange wave 5 of navy blue wave 3 is in play. Wave Cancel invalid level: 7700.13.
The FTSE 100 Elliott Wave analysis on the daily chart provides an insightful overview of the current market conditions using Elliott Wave Theory. Here's a detailed breakdown:
-
Trend Identification: The market is trending, following a specific direction, not exhibiting sideways or erratic movements.
-
Impulsive Mode: The current wave aligns with the overall trend, indicating strong market movement and a continuation of the prevailing trend.
-
Wave Structure: We are in orange wave 5, the final wave in the impulsive sequence of the Elliott Wave cycle. This wave suggests the last leg of the upward movement before a potential larger correction.
-
Current Position: Positioned in navy blue wave 3, indicating an upward phase within the larger impulsive trend.
-
Next Lower Degrees Direction: After orange wave 5 completes, navy blue wave 4 is expected, marking a corrective phase, typically a pullback or retracement, before potentially resuming the upward trend.
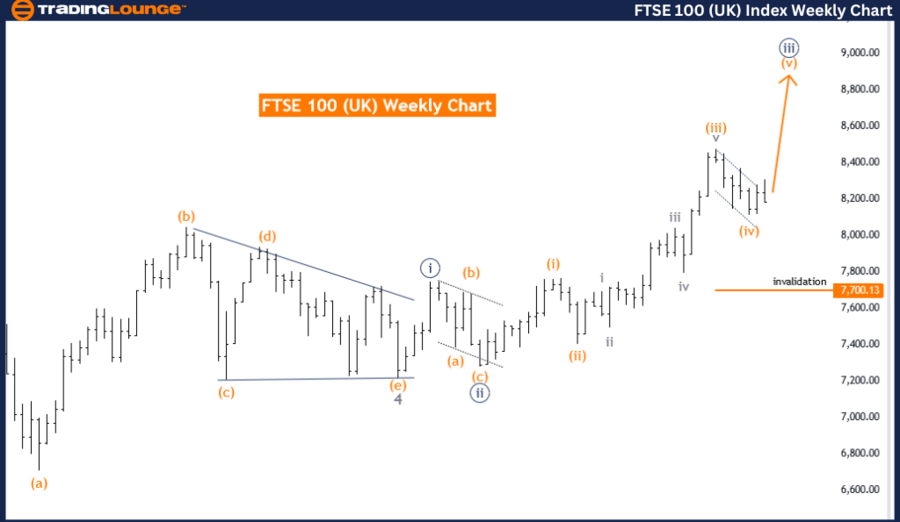
FTSE 100 (UK) Elliott Wave analysis weekly chart
Function: Trend.
Mode: Impulsive.
Structure: Orange Wave 5.
Position: Navy Blue Wave 3.
Direction next lower degrees: Navy Blue Wave 4.
Details: Orange wave 4 looking completed. Now orange wave 5 of navy blue wave 3 is in play. Wave Cancel invalid level: 7700.13.
The FTSE 100 Elliott Wave analysis on the weekly chart provides a comprehensive overview of the current market conditions using Elliott Wave Theory. Here's a detailed breakdown:
-
Trend Identification: The market is trending, moving in a specific direction rather than sideways or erratic movements.
-
Impulsive Mode: The current wave aligns with the overall trend, indicating strong market movement and a continuation of the prevailing trend.
-
Wave Structure: We are in orange wave 5, the final wave in the impulsive sequence of the Elliott Wave cycle. This wave suggests the last leg of the upward movement before a potential larger correction.
-
Current Position: Positioned in navy blue wave 3, indicating an upward phase within the larger impulsive trend.
-
Next Lower Degrees Direction: After orange wave 5 completes, navy blue wave 4 is expected, marking a corrective phase, typically a pullback or retracement, before potentially resuming the upward trend.
Key details:
- Completion of Orange Wave 4: Orange wave 4 appears complete, indicating the market is now in orange wave 5 of navy blue wave 3, a critical phase for traders looking to capitalize on the impulsive trend.
- Wave Cancellation Invalid Level: Set at 7700.13. Falling below this point invalidates the current wave count, necessitating a reevaluation of the wave structure.
Summary:
The FTSE 100 weekly chart analysis identifies:
-
An impulsive trend within orange wave 5.
-
Positioning in navy blue wave 3.
-
Upcoming corrective phase as navy blue wave 4 after orange wave 5 completes.
-
Orange wave 4 completion and progression into orange wave 5 of navy blue wave 3.
-
A significant wave cancel invalid level at 7700.13.
FTSE 100 (UK) Elliott Wave technical analysis [Video]
Author

Peter Mathers
TradingLounge
Peter Mathers started actively trading in 1982. He began his career at Hoei and Shoin, a Japanese futures trading company.


