Fisker Inc. is an US American automotive company. It is producing electric sport utility vehicles (SUVs) like Fisker Ocean, Pear, Ronin and Alaska. Founded 2016, headquartered in Los Angeles, California, US, it is a component of the Russel3000 index. Investors and traders can trade it under the ticker $FSR at NYSE.

Fisker weekly Elliott Wave analysis 01.02.2024

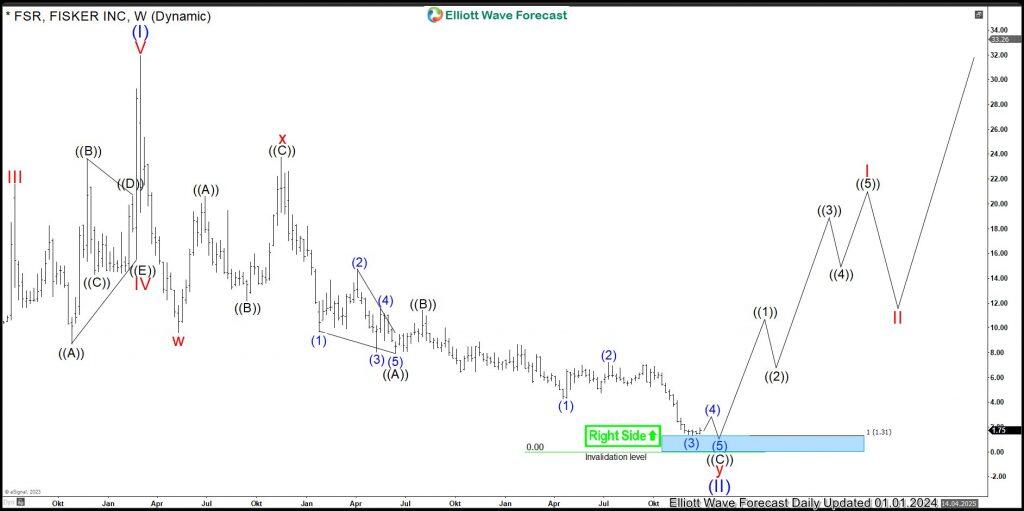
The weekly chart below shows the Fisker shares $FSR traded at New York Stock Exchange. From the all-time lows, the stock price has developed a cycle higher in wave (I). It has printed the all-time highs in March 2021 at 31.96. From the 2020 highs, a correction lower in wave (II) is unfolding as an Elliott wave double three correction pattern being a 3-3-3 structure.

Firstly, 3 waves of red wave w have ended in May 2021 at 9.61 lows. Secondly, a bounce in 3 swings as red wave x has set a connector in November 2021 at 23.75 highs. Currently, final swing lower in red wave y is in progress. As a matter of fact, break of 9.61 lows has opened a bearish sequence. As long as price holds below 23.75, it can reach deeper towards weekly support area. Investors and traders can be looking to buy $FSR from 1.31-0.00 area. There, blue wave (II) should find its bottom and next bullish cycle in blue wave (III) should start. The target for blue wave (III) will be 31.96 and higher in the long run.

Fisker

Share: Feed news

FURTHER DISCLOSURES AND DISCLAIMER CONCERNING RISK, RESPONSIBILITY AND LIABILITY Trading in the Foreign Exchange market is a challenging opportunity where above average returns are available for educated and experienced investors who are willing to take above average risk. However, before deciding to participate in Foreign Exchange (FX) trading, you should carefully consider your investment objectives, level of xperience and risk appetite. Do not invest or trade capital you cannot afford to lose. EME PROCESSING AND CONSULTING, LLC, THEIR REPRESENTATIVES, AND ANYONE WORKING FOR OR WITHIN WWW.ELLIOTTWAVE- FORECAST.COM is not responsible for any loss from any form of distributed advice, signal, analysis, or content. Again, we fully DISCLOSE to the Subscriber base that the Service as a whole, the individual Parties, Representatives, or owners shall not be liable to any and all Subscribers for any losses or damages as a result of any action taken by the Subscriber from any trade idea or signal posted on the website(s) distributed through any form of social-media, email, the website, and/or any other electronic, written, verbal, or future form of communication . All analysis, trading signals, trading recommendations, all charts, communicated interpretations of the wave counts, and all content from any media form produced by www.Elliottwave-forecast.com and/or the Representatives are solely the opinions and best efforts of the respective author(s). In general Forex instruments are highly leveraged, and traders can lose some or all of their initial margin funds. All content provided by www.Elliottwave-forecast.com is expressed in good faith and is intended to help Subscribers succeed in the marketplace, but it is never guaranteed. There is no “holy grail” to trading or forecasting the market and we are wrong sometimes like everyone else. Please understand and accept the risk involved when making any trading and/or investment decision. UNDERSTAND that all the content we provide is protected through copyright of EME PROCESSING AND CONSULTING, LLC. It is illegal to disseminate in any form of communication any part or all of our proprietary information without specific authorization. UNDERSTAND that you also agree to not allow persons that are not PAID SUBSCRIBERS to view any of the content not released publicly. IF YOU ARE FOUND TO BE IN VIOLATION OF THESE RESTRICTIONS you or your firm (as the Subscriber) will be charged fully with no discount for one year subscription to our Premium Plus Plan at $1,799.88 for EACH person or firm who received any of our content illegally through the respected intermediary’s (Subscriber in violation of terms) channel(s) of communication.

Recommended content


Recommended content

Editors’ Picks

AUD/USD hovers around 0.6750 amid cautious mood

AUD/USD hovers around 0.6750 amid cautious mood

AUD/USD is treading water near 0.6750 in Asian trading on Monday. The pair struggles amid a cautious market mood, as traders remain wary of the French elections. However, a subdued US Dollar cushions the Aussie's downside. 

AUD/USD News

USD/JPY drops toward 160.00 as risk aversion seeps back

USD/JPY drops toward 160.00 as risk aversion seeps back

USD/JPY is falling toward 160.00 in the  Asian session on Monday, having failed to sustain at higher levels. A softer risk tone and encouraging Japanese Labor Cash Earnings data lift the Yen, weighing negatively on the pair. 

USD/JPY News

Gold price tumbles as PBoC’s keeps Gold buying on hold

Gold price tumbles as PBoC’s keeps Gold buying on hold

Gold price attracts some sellers during the Asian session on Monday. The precious metal loses traction as the People’s Bank of China, the Chinese central bank kept Gold buying on hold for the second month in June, according to official data released on Sunday.

Gold News

Fourth straight weekly loss for BTC/USD

Fourth straight weekly loss for BTC/USD

BTC/USD remains entrenched in a corrective slide, bolstered by the Fed minutes emphasising reluctance to ease policy until confidence in the disinflation process is observed.

Read more

French election: It’s all over for Marine Le Pen, but the left weighs on the Euro

French election: It’s all over for Marine Le Pen, but the left weighs on the Euro

The deciding vote in the French Parliamentary elections closed this evening, and the exit poll suggests a shock result. The winning party is the left alliance, the popular front, which was pulled together to try and keep Le Pen’s far right National Rally party out of power. 

Read more

Forex MAJORS

Cryptocurrencies

Signatures