Franco Nevada (FNV Stock) may have resumed higher

Franco Nevada (ticker: FNV) is a Canada-based company that own royalties and streams in gold mining and other commodity and natural resource investments. The company does not operate mines, develop projects, or conduct explorations. The entire business model of the company focuses on managing the royalties and streams. In the following article, we will take a look at the Elliott Wave count for the company
Franco Nevada (FNV) monthly Elliott Wave chart
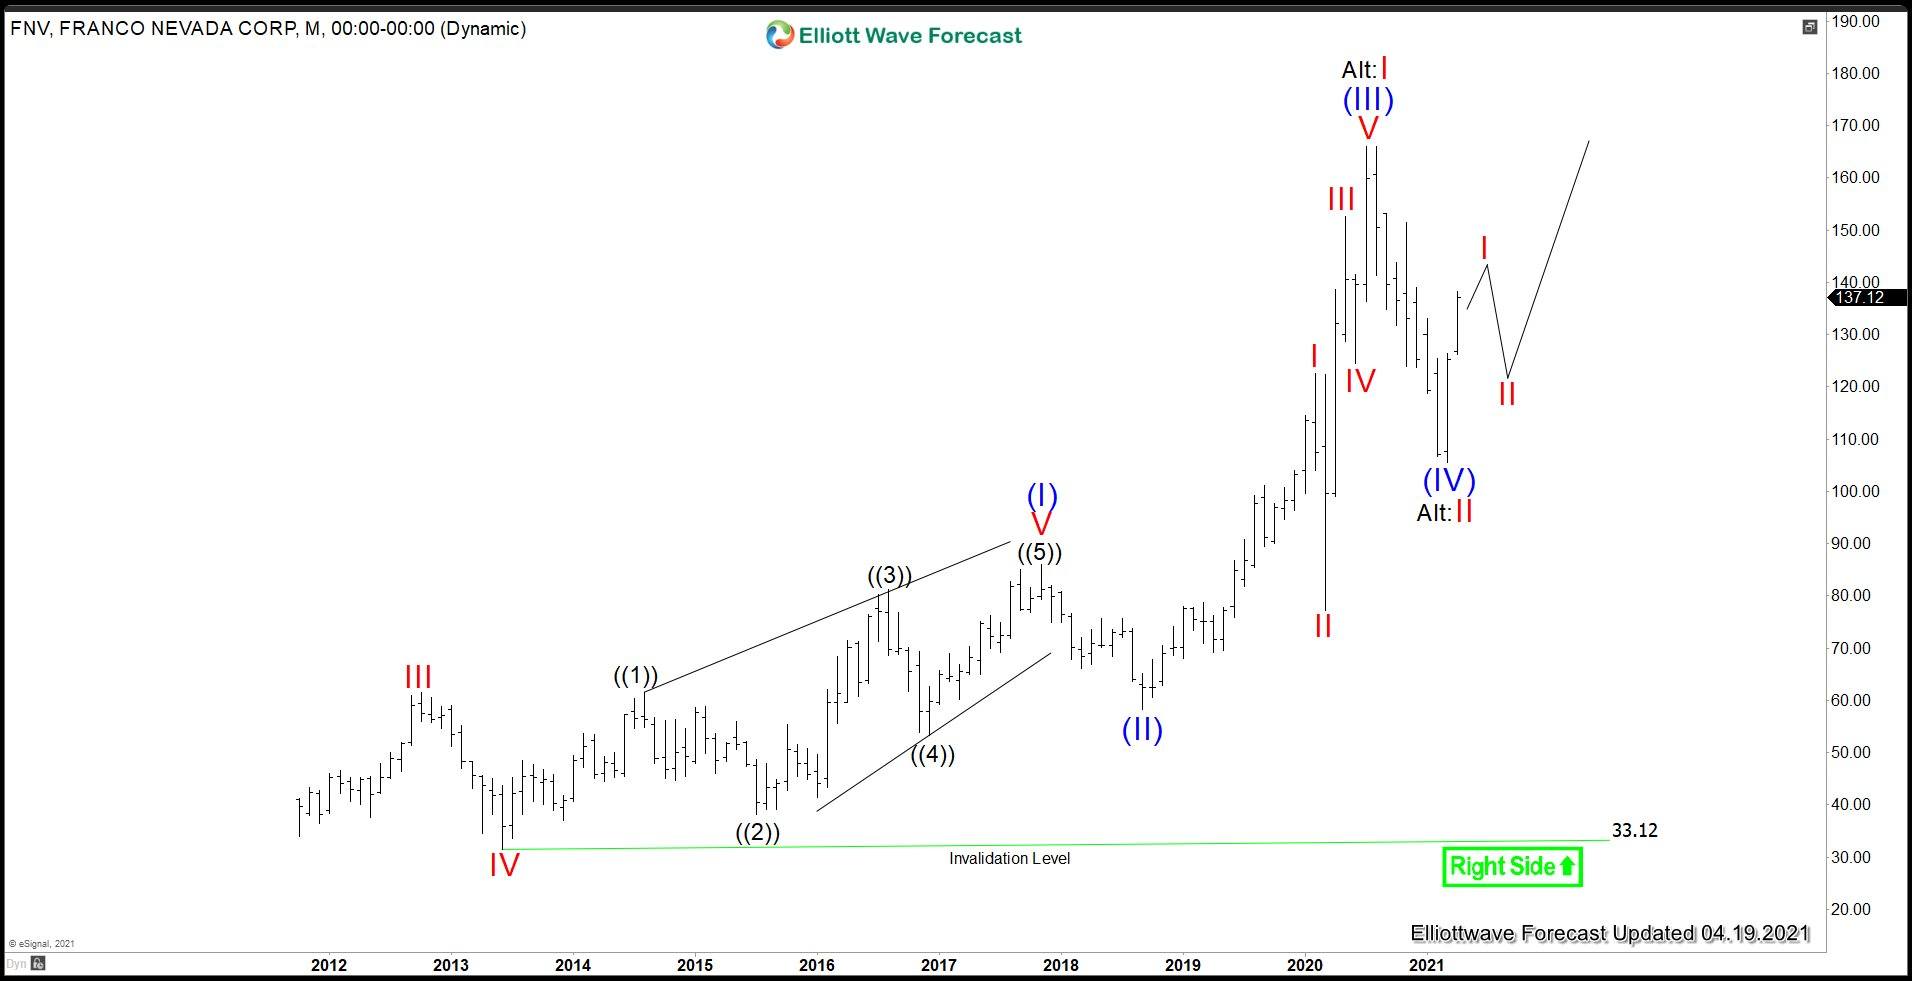
Monthly Elliott Wave chart for FNV above shows that the rally from all-time low is unfolding as a 5 waves impulse Elliott Wave structure. Wave (I) ended at86.08 and pullback in wave (II) ended at 58.26. The stock resumed higher in wave (III) towards 166.11, and pullback in wave (IV) is proposed complete at 105.82. The stock still needs to break above wave (III) to avoid a double correction. Alternatively, the rally can be in a nest where the high on August 5, 2020 ended wave I of (III) and the low on March 1, 2021 ended wave II of (III). The alternate count implies a more bullish view of the stock
FNV daily Elliott Wave chart
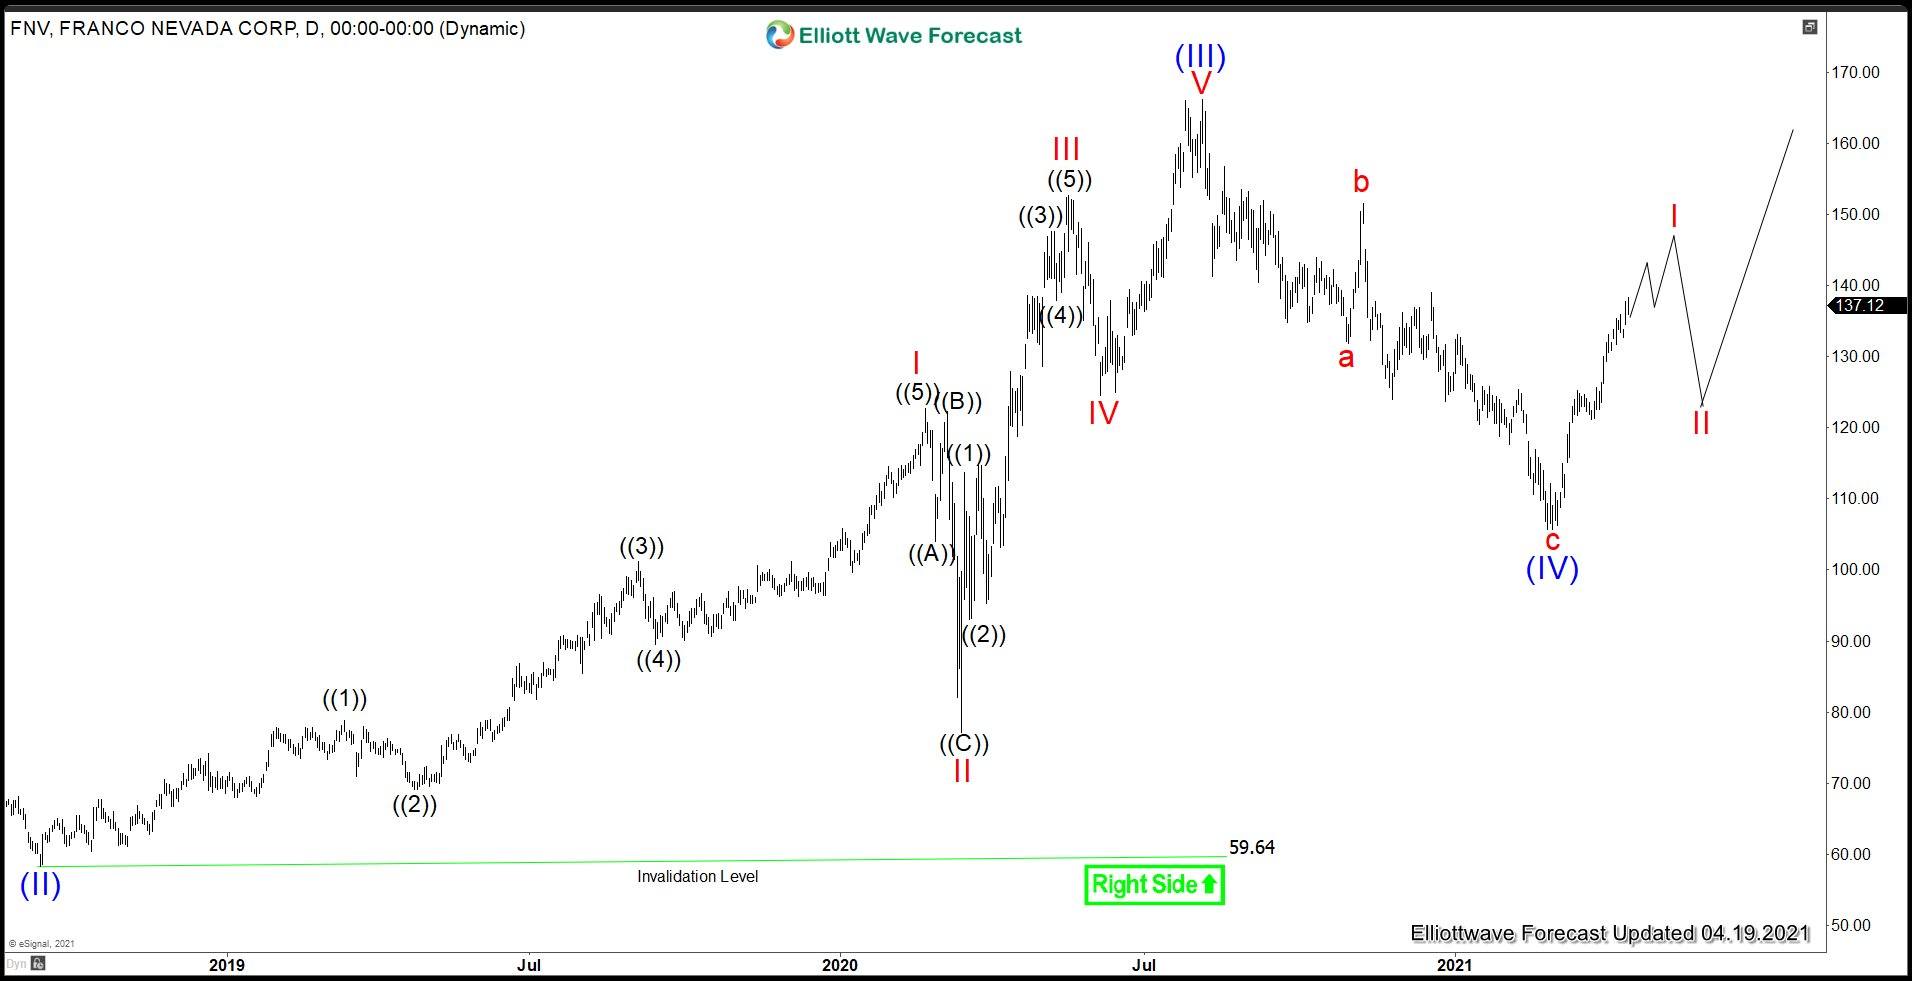
Daily Elliott Wave chart for Franco Nevada (FNV) above suggests that wave (IV) pullback is proposed complete at 105.82. This means that the stock has resumed higher in wave (V) and should eventually break above wave (III) at 166.11. The rally from wave (IV) low so far looks impulsive which supports the idea the correction might be over, although a confirmation and break above wave (III) is still required to rule out a double correction.
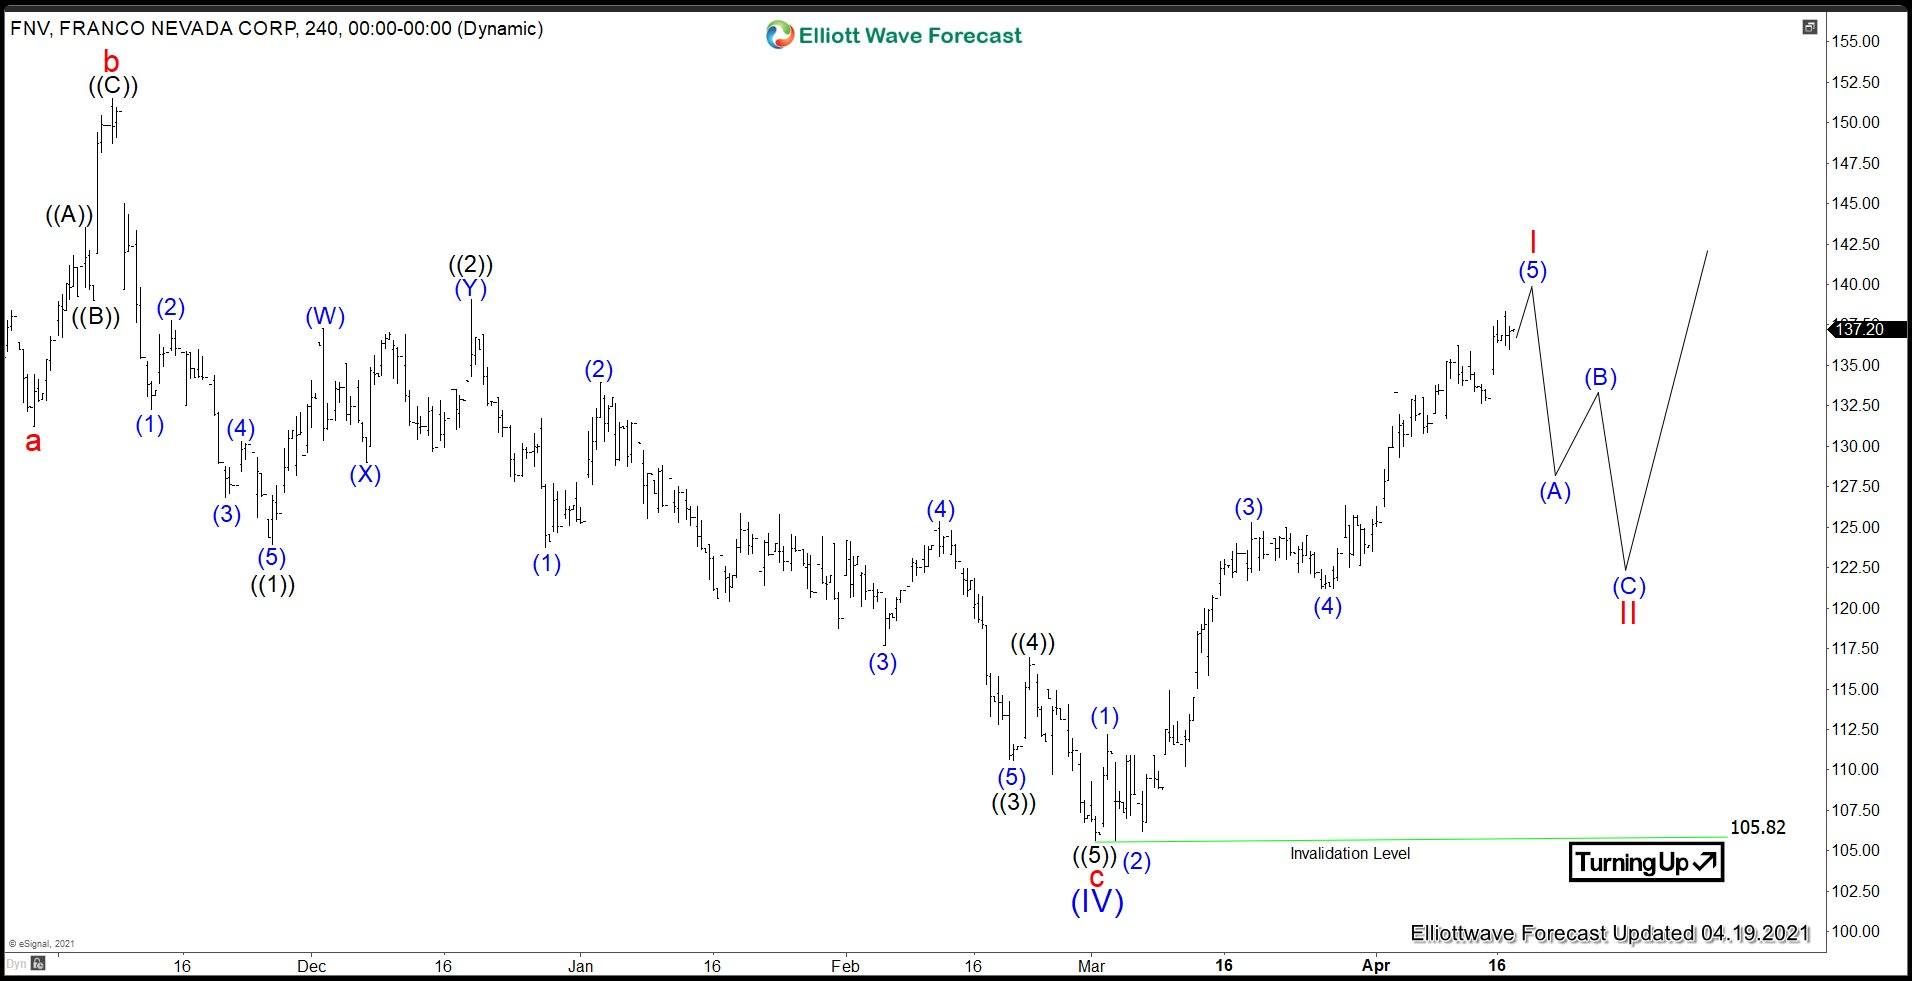
FNV 4 Hour Elliott Wave chart
4 Hour Chart above shows that wave (IV) ended at 105.82 with internal subdivision as a zigzag. Down from wave (III), wave a ended at 131.78, and bounce in wave b ended at 151.48. Stock then resumed lower in wave c towards 105.62. Up from there, wave (1) ended at 112.17 and wave (2) dips ended at 105.64. Stock then resumes higher in wave (3) towards 125.29, and wave (4) dips ended at 121.2. Expect wave (5) to end soon which should complete wave I. Stock then should pullback in wave II to correct cycle from March 2 low before the rally resumes. As far as wave (IV) pivot at 105.82 low stays intact, expect dips to find support in 3, 7, or 11 swing for further upside.
Premium
You have reached your limit of 3 free articles for this month.
Start your subscription and get access to all our original articles.
Author

Elliott Wave Forecast Team
ElliottWave-Forecast.com


