|

Fortinet Inc. (FTNT) stocks Elliott Wave technical analysis [Video]

FTNT Elliott Wave Analysis Trading Lounge.

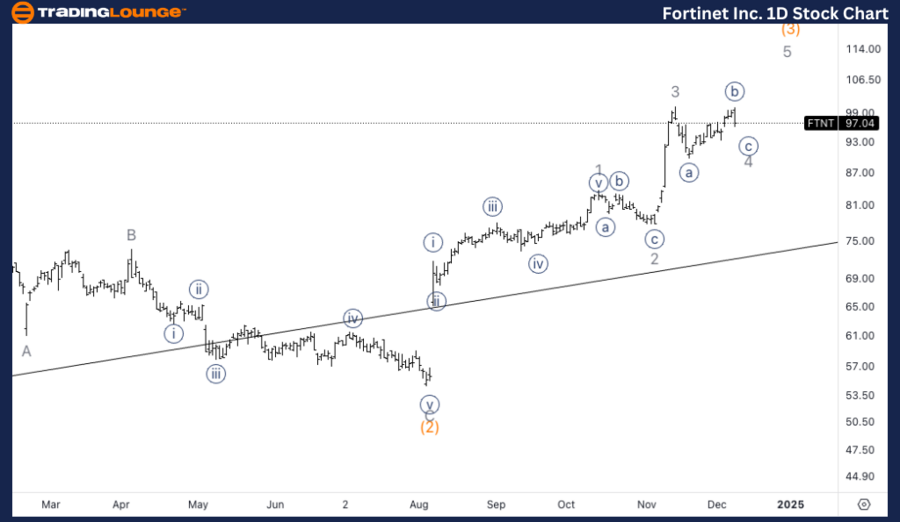
Fortinet Inc., (FTNT) Daily Chart.

FTNT Elliott Wave technical analysis

Function: Trend.

Mode: Impulsive.

Structure: Motive.

Position: Wave (3).

Direction: Upside within wave 5 of (5).

Details: We are looking for a bottom in wave 4 as we have approached TradingLevel1 a 100$.

Chart

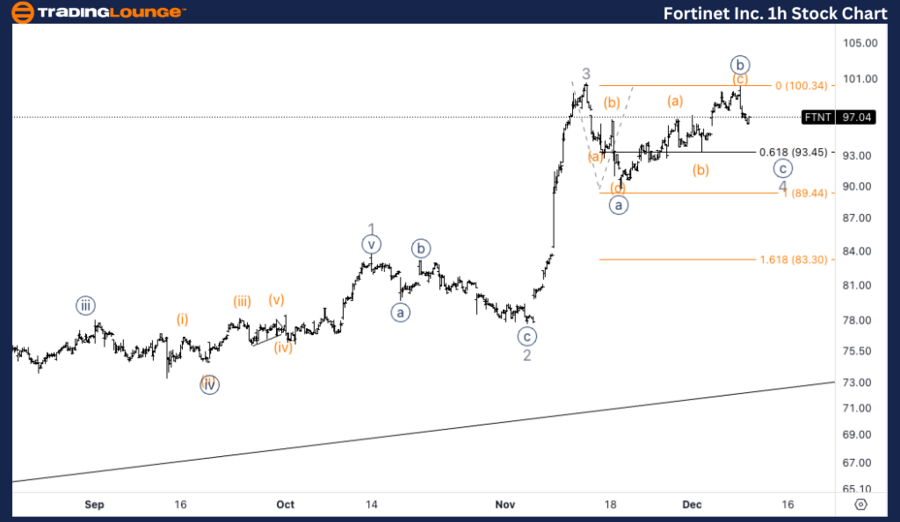
Fortinet Inc., (FTNT) 1H Chart.

FTNT Elliott Wave technical analysis

Function: Trend.

Mode: Impulsive.

Structure: Motive.

Position: Wave {c} of 4.

Direction: Bottom in wave {c}.

Details: Looking for one more leg lower into wave 4 to then turn higher. Equality of {c} vs. {a} stands at 89$ while another feasible target is at 93$ which is 0.618 {c} vs. {a}.

Chart

In this Elliott Wave analysis, we will review the trend structure of Fortinet Inc., (FTNT) using both the daily and 1-hour charts to assess the current wave position and potential price movements.

FTNT Elliott Wave technical analysis – Daily chart

Fortinet (FTNT) appears to be in wave 5 of (5). Currently, it is finding support as it approaches TradingLevel1 at $100, which coincides with the expected completion of wave 4. Once wave 4 forms a bottom, the analysis suggests further upside potential as wave 5 unfolds.

FTNT Elliott Wave technical analysis – One-hour chart

On the 1-hour chart, FTNT is in the final stages of wave {c} of 4, which could complete the wave 4 correction. The next leg lower is anticipated to end around $89 (equality of {c} vs. {a}) or $93, which corresponds to the 0.618 Fibonacci retracement of {c} vs. {a}. After this, we expect a turn higher, marking the beginning of wave 5.

Technical analyst: Alessio Barretta.

FTNT Elliott Wave technical analysis [Video]

Author

Peter Mathers

Peter Mathers

TradingLounge

Peter Mathers started actively trading in 1982. He began his career at Hoei and Shoin, a Japanese futures trading company.

More from Peter Mathers
Share:

Editor's Picks

EUR/USD weakens as US jobs data trims Fed rate cut bets

The EUR/USD pair trades in negative territory for the third consecutive day near 1.1860 during the early European session on Thursday. Traders will keep an eye on the US weekly Initial Jobless Claims data. On Friday, the attention will shift to the US Consumer Price Index inflation report. 

GBP/USD bullish outlook prevails above 1.3600, UK GDP data looms

The GBP/USD pair gains ground near 1.3635, snapping the two-day losing streak during the early European session on Thursday. The preliminary reading of UK Gross Domestic Product for the fourth quarter will be closely watched later on Thursday. The UK economy is estimated to grow 0.2% QoQ in Q4, versus 0.1% in Q1. 

Gold remains on the defensive below two-week top; lacks bearish conviction amid mixed cues

Gold sticks to modest intraday losses through the Asian session on Thursday, though it lacks follow-through selling and remains close to a nearly two-week high, touched the previous day. The commodity currently trades above the $5,070 level, down just over 0.20% for the day, amid mixed cues.

UK GDP set to post weak growth as markets rise bets on March rate cut

Markets will be watching closely on Thursday, when the United Kingdom’s Office for National Statistics will release the advance estimate of Q4 Gross Domestic Product. If the data land in line with consensus, the UK economy would have continued to grow at an annualised pace of 1.2%, compared with 1.3% recorded the previous year. 

The market trades the path not the past

The payroll number did not just beat. It reset the tone. 130,000 vs. 65,000 expected, with a 35,000 whisper. 79 of 80 economists leaning the wrong way. Unemployment and underemployment are edging lower. For all the statistical fog around birth-death adjustments and seasonal quirks, the core message was unmistakable. The labour market is not cracking.

Sonic Labs’ vertical integration fuels recovery in S token

Sonic, previously Fantom (FTM), is extending its recovery trade at $0.048 at the time of writing, after rebounding by over 12% the previous day. The recovery thesis’ strengths lie in the optimism surrounding Sonic Labs’ Wednesday announcement to shift to a vertically integrated model, aimed at boosting S token utility.