Fortinet Inc. (FTNT) Elliott Wave technical analysis [Video]
![Fortinet Inc. (FTNT) Elliott Wave technical analysis [Video]](https://editorial.fxstreet.com/images/Markets/Equities/display-stock-market-charts-23026797_XtraLarge.jpg)
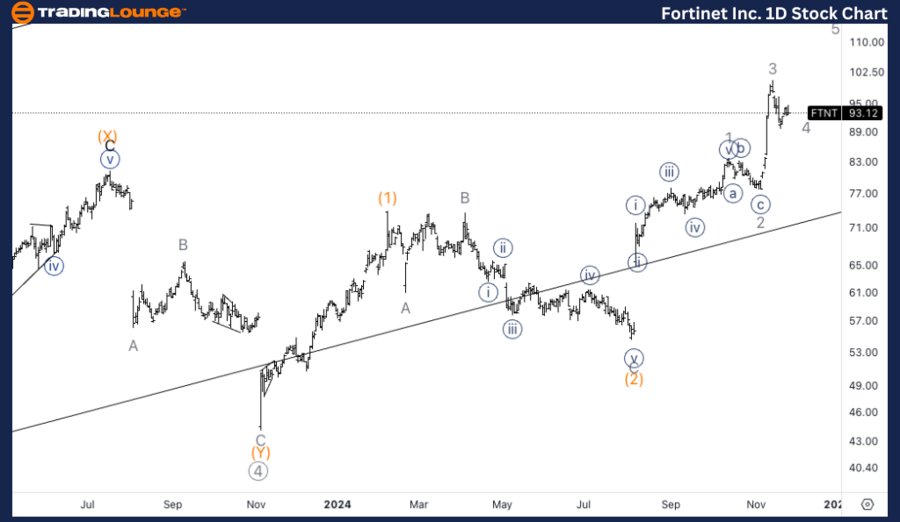
FTNT Elliott Wave technical analysis
Function: Trend.
Mode: Impulsive.
Structure: Motive.
Position: Wave (3).
Direction: Upside within wave (3).
Details: Looking for Intermediate wave (3) to unfold as we have approached TradingLevel1 at 100$. As equality of (3) vs. (1) has been met at 91$, the next target would be 1.618 at 125$.
FTNT Elliott Wave technical analysis – Daily chart
Fortinet (FTNT) is progressing through Intermediate wave (3), which is anticipated to drive prices higher. The stock has reached TradingLevel1 at $100, with equality of wave (3) vs. wave (1) achieved at $91. The next significant target is 1.618 times the length of wave (1), projected at $125, suggesting further upside potential in the ongoing impulsive wave.
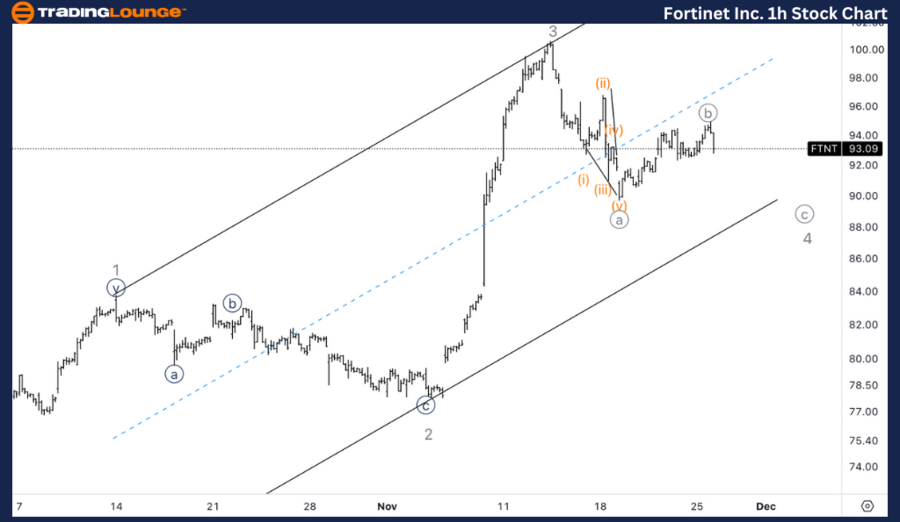
FTNT Elliott Wave technical analysis
Function: Trend
Mode: Impulsive
Structure: Motive
Position: Wave 4 of (3).
Direction: Bottom in wave 4.
Details: Looking for downside into wave 4 to complete the overall correction as we seem to have had a leading diagonal into wave {a} of 4. A valid alternate would suggest we are in wave {ii} of 3 which would then mean higher upside targets.
FTNT Elliott Wave technical analysis – One-hour chart
On the 1-hour chart, Fortinet appears to be in the midst of wave 4 of (3), correcting after the recent gains. The development of a leading diagonal in wave {a} of 4 suggests that the correction may be nearing completion. An alternate count proposes the possibility that the current structure is wave {ii} of 3, indicating the potential for further upside if confirmed. Either way, traders should expect a bounce soon, with wave 4 likely to bottom before resuming the upward trend.
In this Elliott Wave analysis, we will review the trend structure of Fortinet Inc., (FTNT) using both the daily and 1-hour charts to assess the current wave position and potential price movements.
Fortinet Inc. (FTNT) Elliott Wave technical analysis [Video]
Author

Peter Mathers
TradingLounge
Peter Mathers started actively trading in 1982. He began his career at Hoei and Shoin, a Japanese futures trading company.


