Fortescure LTD - FMG Elliott Wave technical forecast [Video]
![Fortescure LTD - FMG Elliott Wave technical forecast [Video]](https://editorial.fxstreet.com/images/Markets/Equities/Industries/Retailing/pic-pexels-artem-beliaikin-2292953-637435400820863972_XtraLarge.jpg)
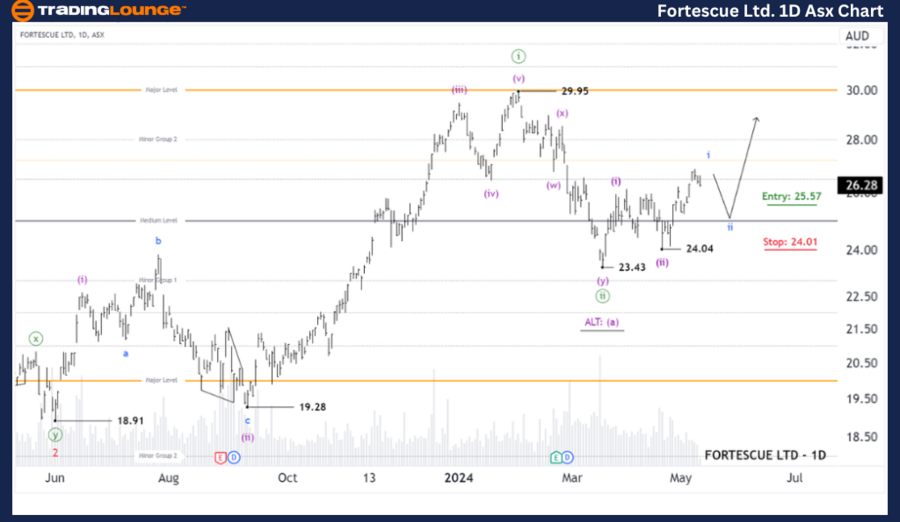
ASX: FORTESCURE LTD – FMG Elliott Elliott Wave Technical Analysis TradingLounge (1D Chart).
Greetings, Our Elliott Wave analysis today updates the Australian Stock Exchange (ASX) with FORTESCURE LTD - FMG. We've identified that wave ((ii)) in green has recently bottomed out, and wave ((iii)) in green is now unfolding to push significantly higher.
ASX: Fortescure LTD - FMG Elliott Wave technical analysis
ASX: FORTESCURE LTD - FMG 1D Chart (Semilog Scale) Analysis.
Function: Major trend (Minute degree, green).
Mode: Motive.
Structure: Impulse.
Position: Wave (iii)-purple of Wave ((iii))-green.
Details: The short-term outlook suggests that wave i in blue is currently unfolding to push higher, and wave ii in blue may soon return to pull back slightly before wave iii in blue resumes to push even higher.
Invalidation point: 23.43.
ASX: Fortescure LTD - FMG Elliott Wave technical analysis
ASX: FORTESCURE LTD - FMG 4-Hour Chart Analysis.
Function: Major trend (Minuette degree, purple).
Mode: Motive.
Structure: Impulse.
Position: Wave ii-blue.
Details: The shorter-term outlook indicates that waves (i) and (ii) in purple have recently completed, and wave (iii) in purple is currently unfolding to push higher. It is subdividing into wave i in blue, which seems to have reached its peak. Therefore, I am open to the possibility that wave ii in blue will unfold to push slightly lower, followed by wave iii in blue resuming to push even higher.
Invalidation point: 24.04.

Conclusion
Our analysis, forecast of contextual trends, and short-term outlook for ASX: FORTESCURE LTD - FMG aim to provide readers with insights into the current market trends and how to capitalize on them effectively. We offer specific price points that act as validation or invalidation signals for our wave count, enhancing the confidence in our perspective. By combining these factors, we strive to offer readers the most objective and professional perspective on market trends.
Technical analyst: Hua (Shane) Cuong, CEWA-M (Master’s Designation).
ASX: Fortescure LTD - FMG Elliott Wave technical analysis [Video]
Author

Peter Mathers
TradingLounge
Peter Mathers started actively trading in 1982. He began his career at Hoei and Shoin, a Japanese futures trading company.


