Fisher and Paykel Healthcare Corporation Limited Elliott Wave analysis [Video]
![Fisher and Paykel Healthcare Corporation Limited Elliott Wave analysis [Video]](https://editorial.fxstreet.com/images/Markets/Equities/Industries/Transportation/airplane-taking-off-637435358049026386_XtraLarge.jpg)
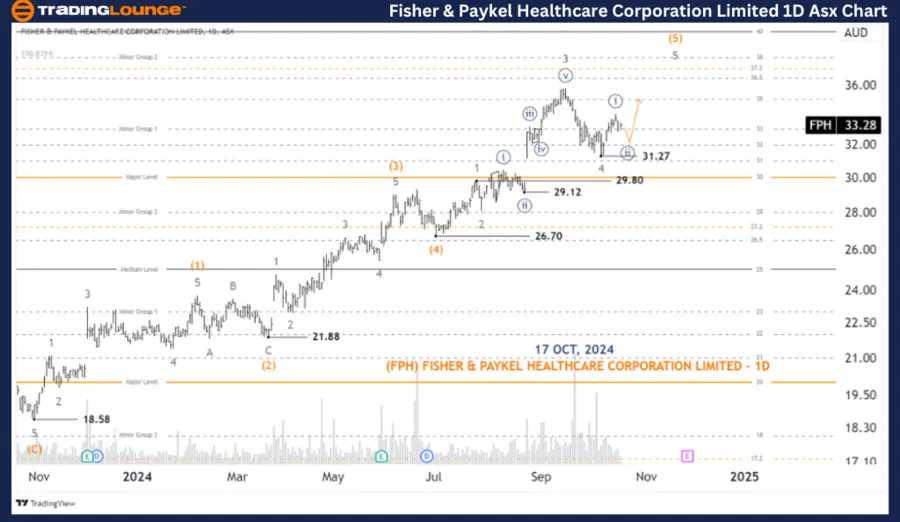
ASX: FPH Elliott Elliott Wave technical analysis
Greetings, Our Elliott Wave analysis today updates the Australian Stock Exchange (ASX FISHER & PAYKEL HEALTHCARE CORPORATION LIMITED – FPH. We see FPH could be about to move up with wave ((iii))-navy, but it needs a little more time for wave ((ii))-navy to complete.
ASX: FPH one-day chart analysis
Function: Major trend (Intermediate degree, orange).
Mode: Motive.
Structure: Impulse.
Position: Wave ((ii))-navy of Wave 5-grey of Wave (5)-orange.
Details: Wave 5-grey is unfolding to push higher, it is subdividing into wave ((ii))-navy, basically it will push lower a bit, then wave ((iii))-navy will come back to push higher.
Invalidation point: 31.27.
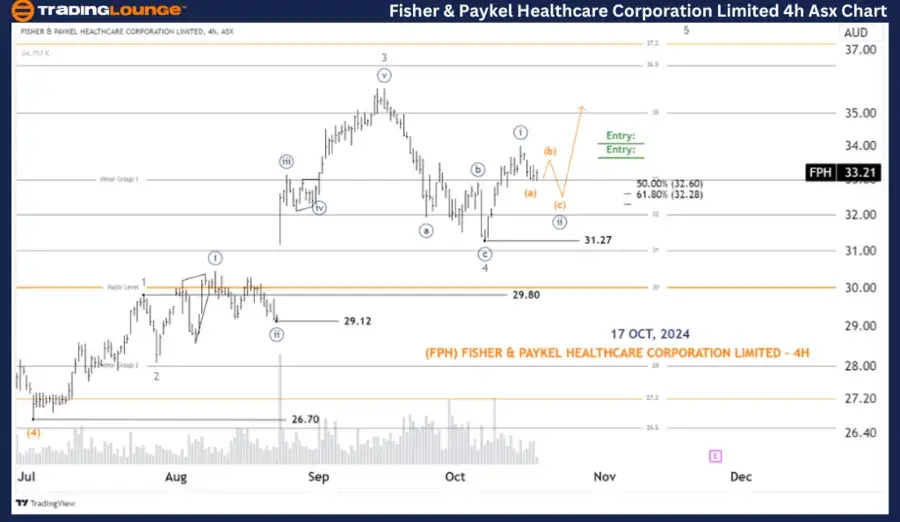
ASX: FPH four-hour chart analysis
Function: Major trend (Minute degree, navy).
Mode: Motive.
Structure: Impulse.
Position: Wave (b)-orange of Wave ((ii))-orange of Wave 5-grey.
Details: Looking closer, wave ((i))-navy has ended, now wave ((ii))-navy unfolds to push lower to complete its role as (a),(b),(c). After wave ((ii))-navy ends, wave ((iii))-navy will return to push higher. And 33.00 could become a tested support level, then it could go Long higher.
Invalidation point: 31.27.
Conclusion
Our analysis, forecast of contextual trends, and short-term outlook for ASX: FISHER & PAYKEL HEALTHCARE CORPORATION LIMITED – FPH aim to provide readers with insights into the current market trends and how to capitalize on them effectively. We offer specific price points that act as validation or invalidation signals for our wave count, enhancing the confidence in our perspective. By combining these factors, we strive to offer readers the most objective and professional perspective on market trends.
Fisher & Paykel Healthcare Corporation Limited Elliott Wave analysis [Video]
Author

Peter Mathers
TradingLounge
Peter Mathers started actively trading in 1982. He began his career at Hoei and Shoin, a Japanese futures trading company.


