In the previous articles from March and November 2021, we have discussed the price action and the outlook for the Frozen Concentrated Orange Juice. As it has been expected, the soft commodities have advanced. In particular, we saw commodities like coffee, cocoa, cotton and sugar extending higher. Hereby, orange juice futures OJ #F have rallied as well. Now, we see a higher high in Weekly view confirming our bullish view. Short-term pullbacks should and will happen providing an opportunity both for investors and traders.
Orange juice monthly Elliott Wave analysis 10.02.2022
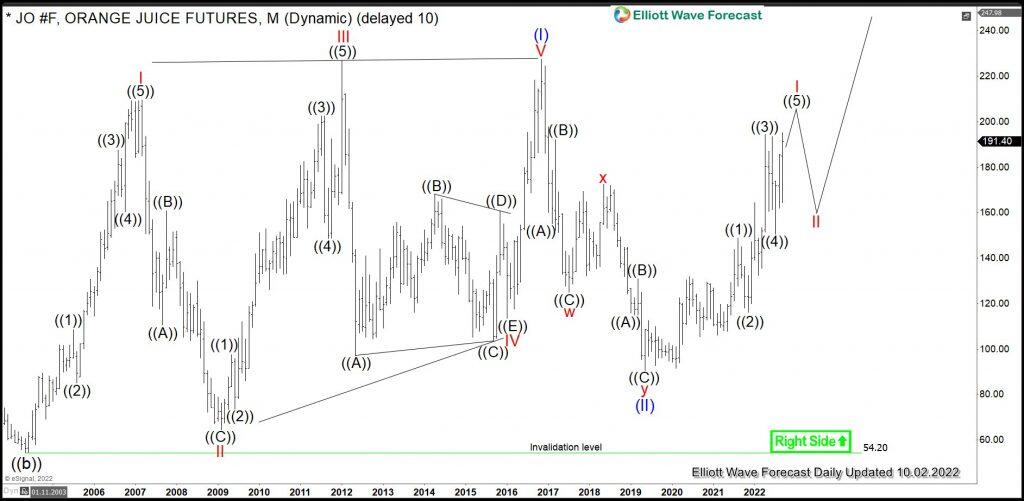
The monthly chart below shows the FCOJ front contract OJ #F at NYBOT (e-Signal ticker: JO). From the important low in May 2004, the prices have developed a cycle higher in blue wave (I) of a super cycle degree. Hereby, wave (I) has demonstrated a leading diagonal pattern and has ended in October 2016 at 227.50. From the all-time highs, a correction lower in wave (II) has unfolded as an Elliott Wave double three pattern. In 2.5 years, OJ #F has become cheaper by 60% reaching 90.60 level. It is the preferred view that an important bottom in May 2019 has been set and the correction has ended. From the lows, a new rally in prices within blue wave (III) may have already started. For 2023-2030, the expectations are to break to the new all-time highs. The target for wave (III) will be 264.00-371.20 area. From current levels, the orange juice can, therefore, double in price.
Orange juice weekly Elliott Wave analysis 10.02.2022
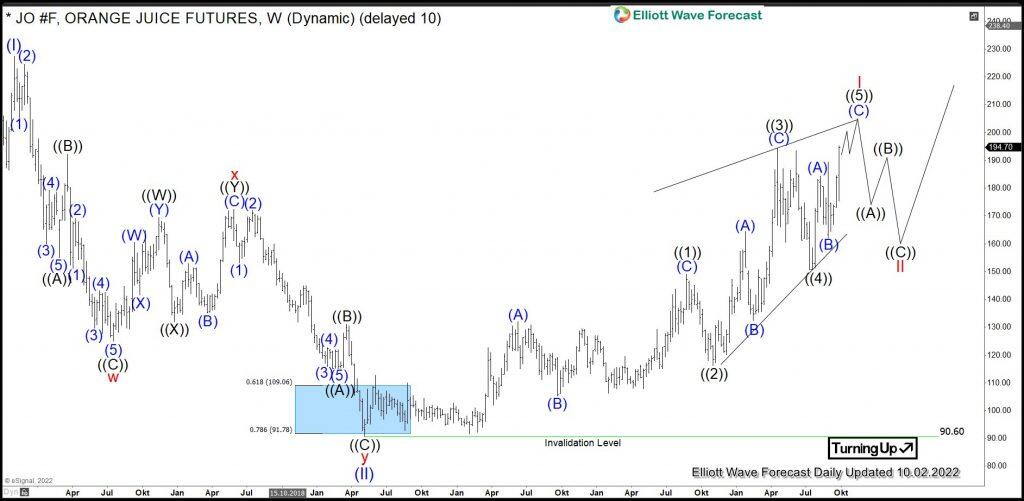
The weekly chart below shows in more detail the decline lower in wave (II) and the initial cycle within red wave I of the blue wave (III). From the 90.60 lows, we see the advance higher as a leading diagonal in wave I demonstrating a 3-3-3-3-3 structure. Recently, we saw a new high with a divergence. As a matter of fact, divergence does not mean that it should pullback. Orange juice can accelerate higher. Correlation with the entire market tells, however, that a pullback should happen. It can correct the cycle from May 2019 lows in 3, 7, 11 swings before upside resumes.
Investors and traders can be, therefore, looking to buy FCOJ in a pullback against 90.60 low targeting 264.00-371.20 area in medium to long term time perspective.
FURTHER DISCLOSURES AND DISCLAIMER CONCERNING RISK, RESPONSIBILITY AND LIABILITY Trading in the Foreign Exchange market is a challenging opportunity where above average returns are available for educated and experienced investors who are willing to take above average risk. However, before deciding to participate in Foreign Exchange (FX) trading, you should carefully consider your investment objectives, level of xperience and risk appetite. Do not invest or trade capital you cannot afford to lose. EME PROCESSING AND CONSULTING, LLC, THEIR REPRESENTATIVES, AND ANYONE WORKING FOR OR WITHIN WWW.ELLIOTTWAVE- FORECAST.COM is not responsible for any loss from any form of distributed advice, signal, analysis, or content. Again, we fully DISCLOSE to the Subscriber base that the Service as a whole, the individual Parties, Representatives, or owners shall not be liable to any and all Subscribers for any losses or damages as a result of any action taken by the Subscriber from any trade idea or signal posted on the website(s) distributed through any form of social-media, email, the website, and/or any other electronic, written, verbal, or future form of communication . All analysis, trading signals, trading recommendations, all charts, communicated interpretations of the wave counts, and all content from any media form produced by www.Elliottwave-forecast.com and/or the Representatives are solely the opinions and best efforts of the respective author(s). In general Forex instruments are highly leveraged, and traders can lose some or all of their initial margin funds. All content provided by www.Elliottwave-forecast.com is expressed in good faith and is intended to help Subscribers succeed in the marketplace, but it is never guaranteed. There is no “holy grail” to trading or forecasting the market and we are wrong sometimes like everyone else. Please understand and accept the risk involved when making any trading and/or investment decision. UNDERSTAND that all the content we provide is protected through copyright of EME PROCESSING AND CONSULTING, LLC. It is illegal to disseminate in any form of communication any part or all of our proprietary information without specific authorization. UNDERSTAND that you also agree to not allow persons that are not PAID SUBSCRIBERS to view any of the content not released publicly. IF YOU ARE FOUND TO BE IN VIOLATION OF THESE RESTRICTIONS you or your firm (as the Subscriber) will be charged fully with no discount for one year subscription to our Premium Plus Plan at $1,799.88 for EACH person or firm who received any of our content illegally through the respected intermediary’s (Subscriber in violation of terms) channel(s) of communication.
Recommended content
Editors’ Picks

EUR/USD trades with sizeable gains above 1.1500, at over three-year highs
EUR/USD trades over 1% higher so far this Monday as the relentless selling interest in the US Dollar keeps it well above the 1.1500 threshold - the highest level since November 2021. Growing concerns over a US economic recession and the Federal Reserve’s autonomy continue to exert downward pressure on the USD.

Gold stands tall on concerns over trade war, Fed’s independence
Gold price closes on $3,400 as the record rally regains strength on Easter Monday. Concerns over US-China trade war escalation and the Fed’s independence smash the US Dollar to three-year troughs. RSI stays overbought on the daily chart, with thin volumes likely to exaggerate moves in Gold price.

GBP/USD stays strongly bid near 1.3400 on intense US Dollar weakness
GBP/USD continues its winning streak that began on April 8, trading close to 1.3400 in early Europe on Monday. The extended US Dollar weakness, amid US-Sino trade war-led recession fears and heightened threat to the Fed's independence, continue to underpin the pair. Thin trading is set to extend.

Bitcoin finally breaks out, Ethereum and Ripple could follow
Bitcoin's price broke above its key resistance level after facing multiple rejections around it the previous week. Ethereum and Ripple prices are approaching their key resistance levels; a breakout could signal a rally ahead.

Future-proofing portfolios: A playbook for tariff and recession risks
It does seem like we will be talking tariffs for a while. And if tariffs stay — in some shape or form — even after negotiations, we’ll likely be talking about recession too. Higher input costs, persistent inflation, and tighter monetary policy are already weighing on global growth.

The Best brokers to trade EUR/USD
SPONSORED Discover the top brokers for trading EUR/USD in 2025. Our list features brokers with competitive spreads, fast execution, and powerful platforms. Whether you're a beginner or an expert, find the right partner to navigate the dynamic Forex market.


