|premium|

Facebook (FB Stock): Elliott Wave view – Correction may extend [Video]

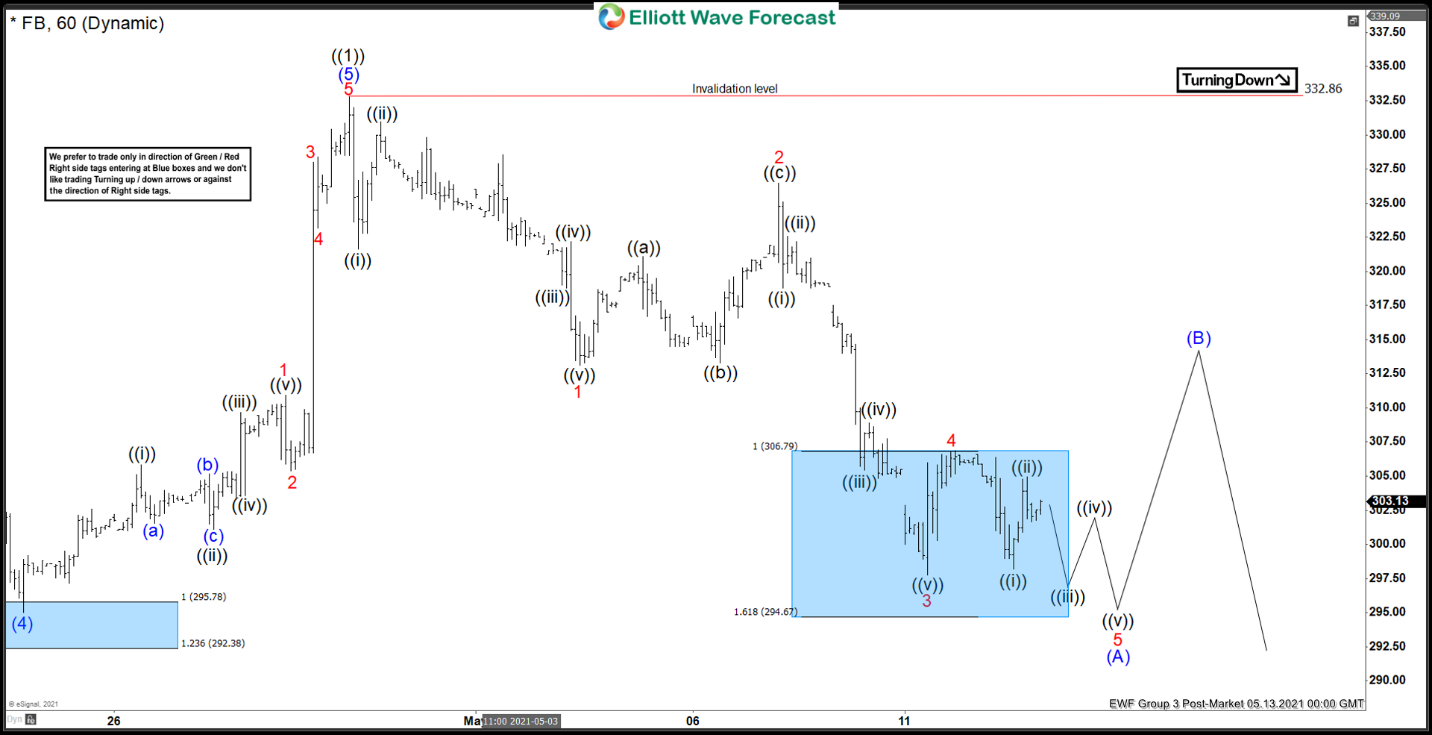
Short Term Elliott Wave structure for Facebook (FB) suggests the rally from January 14, 2021 low ended wave ((1)) at 322.86 as an impulse Elliott Wave structure. In the 1 hour chart below, we can see wave (4) of this impulse ended at 295 and from there it rallied in wave (5) as an impulse in a lesser degree towards 322.86. This completed wave ((1)) in a higher degree.

Wave ((2)) pullback is currently in progress to correct cycle from January 14 low before the rally in the stock resumes. Internal subdivision of wave ((2)) is proposed to be in a zigzag Elliott Wave structure. Down from wave ((1)), wave 1 ended at 313 and wave 2 bounce ended at 326.44. Stock then resumed lower in wave 3 towards 297.75, and bounce in wave 4 ended at 306.83. Facebook now can see 1 more leg lower to end wave 5 which should complete wave (A) in higher degree.

Afterwards, the stock should see a wave (B) bounce to correct cycle from April 29 high before the decline resumes in wave (C) of ((2)). As far as pivot at 332.86 high stays intact, expect rally to fail in the sequence of 3, 7, or 11 swing for another leg lower.

Facebook (FB) 60 Minutes Elliott Wave Chart

Chart

FB Elliott Wave Video

Premium

You have reached your limit of 3 free articles for this month.

Start your subscription and get access to all our original articles.

Subscribe to PremiumSign In

Author

Elliott Wave Forecast Team

Elliott Wave Forecast Team

ElliottWave-Forecast.com

More from Elliott Wave Forecast Team
Share:

Editor's Picks

EUR/USD holds near 1.1900 ahead of US data

EUR/USD struggles to build on Monday's gains and fluctuates near 1.1900 on Tuesday. Markets turn cautious, lifting the haven demand for the US Dollar ahead of the release of key US economic data, including Retail Sales and ADP Employment Change 4-week average.

GBP/USD declines toward 1.3650 on renewed USD strength

GBP/USD stays on the back foot and declines to the 1.3650 region on Tuesday. The negative shift seen in risk mood helps the US Dollar (USD) gather strength and makes it difficult for the pair to find a foothold. The immediate focus is now on the US Retail Sales data. 

Gold stabilizes above $5,000 ahead of US data

Gold enters a consolidation phase after posting strong gains on Monday but stays above the $5,000 psychological mark and the daily swing low. US Treasury bond yields continue to edge lower on news of Chinese regulators advising financial institutions to curb holdings of US Treasuries, helping XAU/USD hold its its ground.

Bitcoin Cash trades lower, risks dead-cat bounce amid bearish signals

Bitcoin Cash trades in the red below $522 at the time of writing on Tuesday, after multiple rejections at key resistance. BCH’s derivatives and on-chain indicators point to growing bearish sentiment and raise the risk of a dead-cat bounce toward lower support levels.

Dollar drops and stocks rally: The week of reckoning for US economic data

Following a sizeable move lower in US technology Stocks last week, we have witnessed a meaningful recovery unfold. The USD Index is in a concerning position; the monthly price continues to hold the south channel support.

Bitcoin Cash trades lower, risks dead-cat bounce amid bearish signals

Bitcoin Cash (BCH) trades in the red below $522 at the time of writing on Tuesday, after multiple rejections at key resistance. BCH’s derivatives and on-chain indicators point to growing bearish sentiment and raise the risk of a dead-cat bounce toward lower support levels.