Exxon Mobil Inc Elliott Wave technical analysis [Video]
![Exxon Mobil Inc Elliott Wave technical analysis [Video]](https://editorial.fxstreet.com/images/Markets/Equities/Industries/Staples/pic-pexels-pixabay-256455-637435397029183920_XtraLarge.jpg)
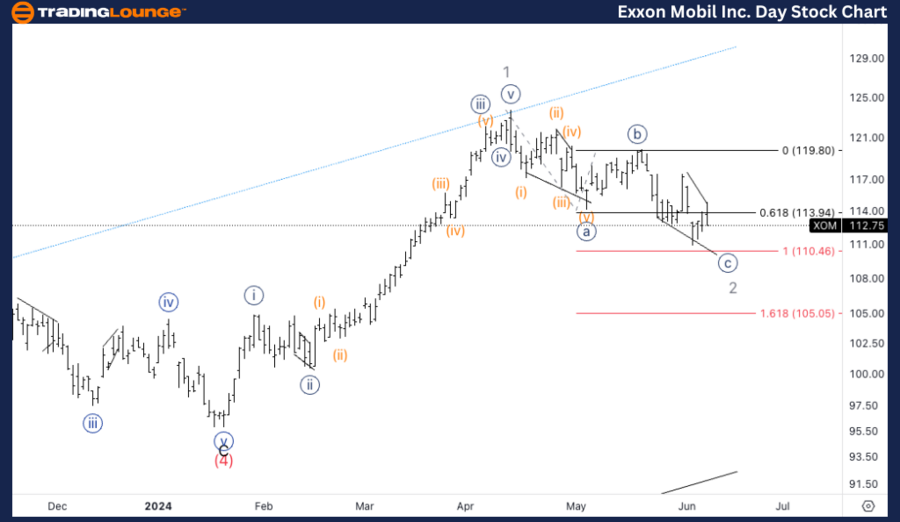
XOM Elliott Wave Analysis Trading Lounge Daily Chart,
Exxon Mobil Inc., (XOM) Daily Chart.
XOM Elliott Wave technical analysis
Function: Counter Trend.
Mode: Corrective.
Structure: Zigzag.
Position: Wave 2.
Direction: Bottom in wave 2.
Details: Looking for a pullback in minor wave 2 of (5), there is a possibility we could already have topped in wave (5).
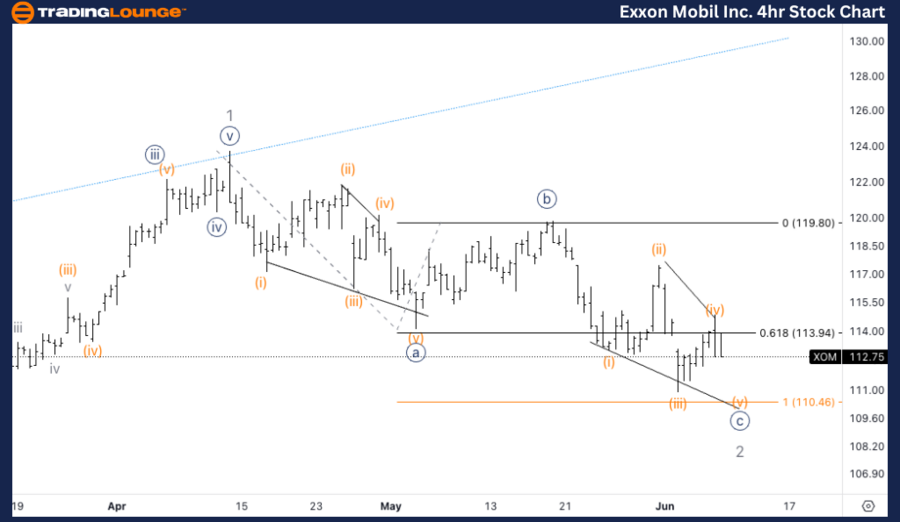
XOM Elliott Wave Analysis Trading Lounge 4Hr Chart,
Exxon Mobil Inc., (XOM) 4Hr Chart.
XOM Elliott Wave technical analysis
Function: Counter Trend.
Mode: Corrective.
Structure: Zigzag.
Position: Wave {c} of 2.
Direction: Downside in wave {c}.
Details: Zooming into wave 2 we are looking at a potential rare event in both a leading diagonal in wave {a} and an ending diagonal in wave {c}. Looking for a bounce off equality of {c} vs. {a}. at 110$.
Welcome to our latest Elliott Wave analysis for Exxon Mobil Inc. (XOM) as of June 10, 2024. This analysis provides an in-depth look at XOM's price movements using the Elliott Wave Theory, helping traders identify potential opportunities based on current trends and market structure. We will cover insights from both the daily and 4-hour charts to offer a comprehensive perspective on XOM's market behavior.
XOM Elliott Wave technical analysis – Daily chart
In our Elliott Wave analysis of Exxon Mobil Inc. (XOM), we observe a counter-trend corrective pattern characterized by a Zigzag structure. XOM is currently positioned in Wave 2, suggesting a bottom in this corrective phase. We anticipate a pullback in Minor wave 2 of (5), indicating that there may have already been a top in wave (5). Traders should closely monitor for signs of a completed correction and the start of a new upward move. The key support level around $110 will be critical for confirming the end of this corrective wave and the resumption of the primary trend.
XOM Elliott Wave technical analysis – Four-hour chart
On the 4-hour chart, XOM is exhibiting a counter-trend corrective mode within a Zigzag structure, specifically in wave {c} of 2. The current analysis shows that wave 2 is featuring a rare scenario with both a leading diagonal in wave {a} and an ending diagonal in wave {c}. We are looking for a bounce at the equality of {c} vs. {a} around the $110 level. If this level holds, it could signal the completion of wave {c} and the end of the corrective phase, providing a potential entry point for traders looking to capitalize on a bullish reversal.
Technical analyst: Alessio Barretta.
XOM Elliott Wave technical analysis [Video]
Author

Peter Mathers
TradingLounge
Peter Mathers started actively trading in 1982. He began his career at Hoei and Shoin, a Japanese futures trading company.


