Euro Stoxx 50 index Elliott Wave technical analysis [Video]
![Euro Stoxx 50 index Elliott Wave technical analysis [Video]](https://editorial.fxsstatic.com/images/i/Equity-Index_S&P500-1_XtraLarge.jpg)
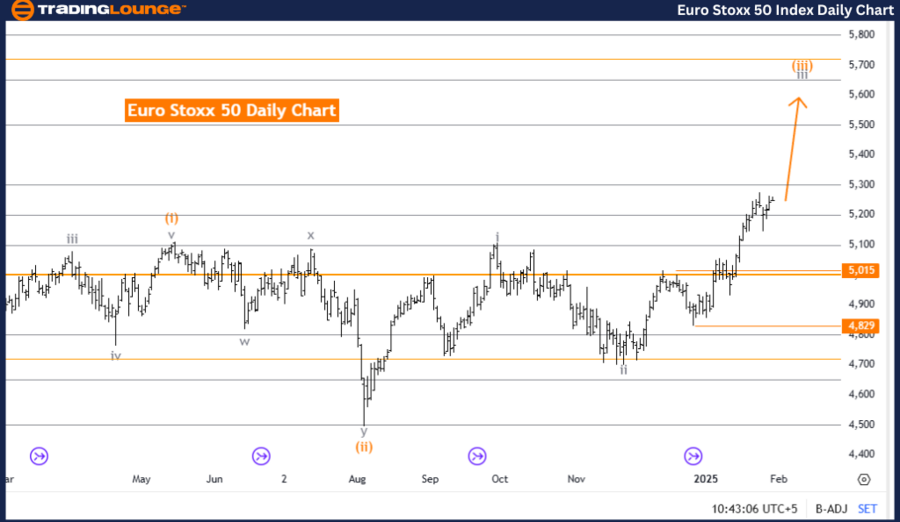
Euro Stoxx 50 Elliott Wave Analysis – Trading Lounge Day Chart.
Euro Stoxx 50 Elliott Wave technical analysis
-
Function: Bullish Trend.
-
Mode: Impulsive.
-
Structure: Gray Wave 3.
-
Position: Orange Wave 3.
-
Direction next lower degrees: Gray Wave 4.
-
Details: Gray Wave 2 appears completed. Now, Gray Wave 3 of Orange Wave 3 is in play.
-
Wave cancellation invalid level: 4,829
The Euro Stoxx 50 Elliott Wave Analysis on the daily chart provides a detailed technical outlook, highlighting the index’s current bullish trend. The analysis identifies the market mode as impulsive, signaling a strong and sustained upward movement.
The wave structure is labeled Gray Wave 3, which forms part of a larger Elliott Wave cycle. This wave is positioned within Orange Wave 3, making it a sub-wave within a higher-degree trend.
According to the analysis, Gray Wave 2 has likely completed, and the market is now developing Gray Wave 3 of Orange Wave 3. This suggests a continuation of the bullish trend, with potential for further upward movement.
The next expected phase at a lower degree is Gray Wave 4, which is typically a corrective phase following the completion of an impulsive wave. Traders should closely track the development of Gray Wave 3, as its completion will likely signal the beginning of Gray Wave 4.
A wave cancellation invalidation level is set at 4,829. If the price falls below this threshold, the current wave count would be invalidated, necessitating a reassessment of the Elliott Wave structure.
Summary
-
The Euro Stoxx 50 is in an impulsive bullish phase, identified as Gray Wave 3, within Orange Wave 3.
-
The completion of Gray Wave 2 has allowed the continuation of upward momentum in Gray Wave 3.
-
Traders should monitor the progression of Gray Wave 3 and observe the invalidation level at 4,829 to confirm the validity of the current Elliott Wave structure.
This analysis offers a structured framework to understand the current market position and anticipate future price movements within the broader bullish trend.
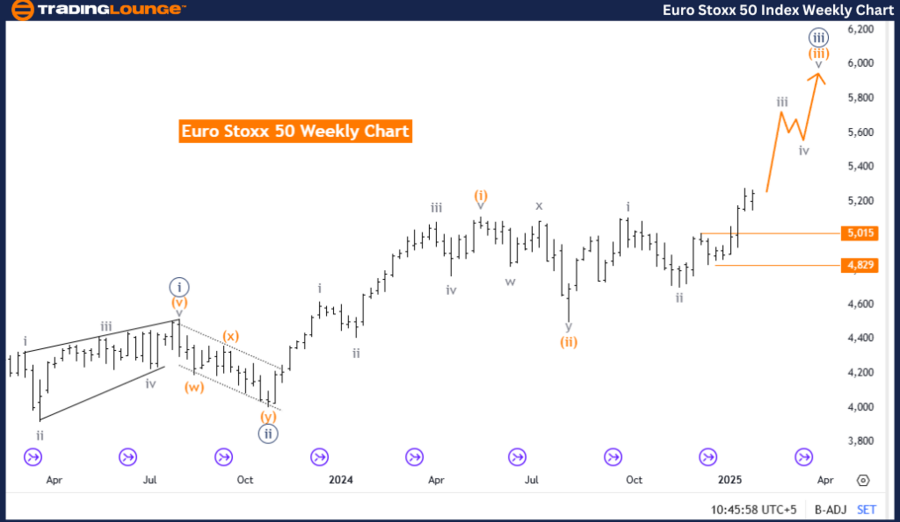
Euro Stoxx 50 Elliott Wave Analysis – Trading Lounge Weekly Chart.
Euro Stoxx 50 Elliott Wave technical analysis
-
Function: Bullish Trend.
-
Mode: Impulsive.
-
Structure: Orange Wave 3.
-
Position: Navy Blue Wave 3.
-
Direction next lower degrees: Orange Wave 4.
-
Details: Orange Wave 2 appears completed. Now, Orange Wave 3 of 3 is in play.
-
Wave cancellation invalid level: 4,829.
The Euro Stoxx 50 Elliott Wave Analysis on the weekly chart provides a comprehensive technical outlook on the index, emphasizing its bullish trend. The market mode is identified as impulsive, suggesting a strong and sustained upward movement.
The wave structure is labeled Orange Wave 3, forming part of a larger Elliott Wave cycle. It is positioned within Navy Blue Wave 3, meaning it acts as a sub-wave within a higher-degree trend.
The analysis indicates that Orange Wave 2 has likely completed, and the market is currently forming Orange Wave 3 of 3, signaling a continuation of the bullish trend with potential for significant upward momentum.
At the next lower degree, the market is expected to move into Orange Wave 4, typically a corrective phase following the completion of an impulsive wave. Traders should closely track the development of Orange Wave 3, as its completion will likely mark the beginning of Orange Wave 4.
A wave cancellation invalidation level is set at 4,829. If the price drops below this level, the current wave count would be invalidated, requiring a reassessment of the Elliott Wave structure.
Summary
-
The Euro Stoxx 50 is in an impulsive bullish phase, identified as Orange Wave 3, within Navy Blue Wave 3.
-
The completion of Orange Wave 2 has paved the way for the continuation of upward movement in Orange Wave 3 of 3.
-
Traders should monitor the progression of Orange Wave 3 and watch for the invalidation level at 4,829 to confirm the validity of the current Elliott Wave structure.
This analysis provides a structured framework for understanding the current market position and forecasting future price movements within the broader bullish trend.
Technical analyst: Malik Awais.
Euro Stoxx 50 Elliott Wave technical analysis [Video]
Author

Peter Mathers
TradingLounge
Peter Mathers started actively trading in 1982. He began his career at Hoei and Shoin, a Japanese futures trading company.


