Euro Stoxx 50 index Elliott Wave technical analysis [Video]
![Euro Stoxx 50 index Elliott Wave technical analysis [Video]](https://editorial.fxstreet.com/images/Markets/Equities/Industries/Pharma/man-microscope-pharma_XtraLarge.jpg)
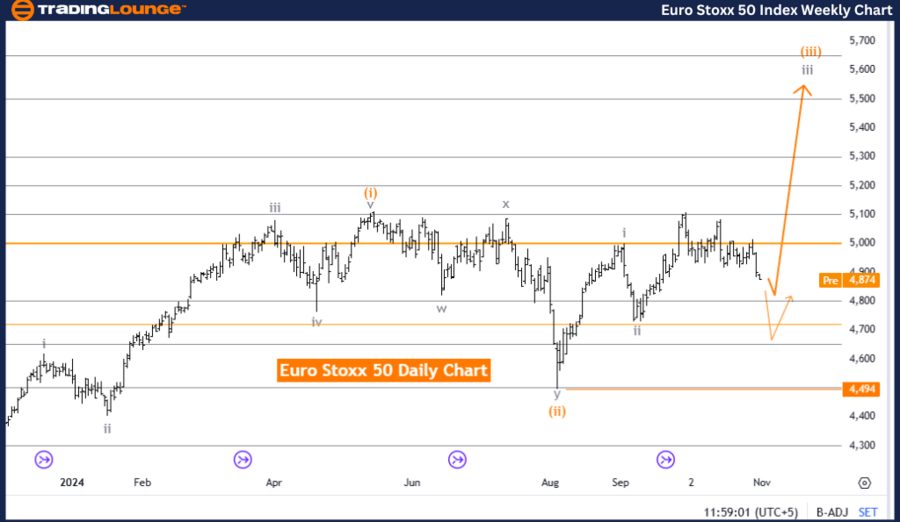
Euro Stoxx 50 Elliott Wave Analysis Trading Lounge Day Chart
Euro Stoxx 50 Elliott Wave technical analysis
-
Function: Bullish Trend.
-
Mode: Impulsive.
-
Structure: Gray wave 3.
-
Position: Orange wave 3.
-
Next higher degree direction: Gray wave 3 (initiated)
Details:
Gray wave 2 appears complete, with gray wave 3 of orange wave 3 now in motion.
-
Wave cancel level: 4,494.
Euro Stoxx 50 Day chart analysis
The daily Elliott Wave analysis of the Euro Stoxx 50 indicates a bullish trend within an impulsive market structure. The current wave configuration, marked as gray wave 3 within orange wave 3, points to the continuation of the upward trend. This setup reflects the likely completion of gray wave 2, with gray wave 3 now actively unfolding within orange wave 3, marking a strong advancement in the bullish direction.
This structure suggests a sustained upward trend, as gray wave 3 within orange wave 3 typically signals significant gains in alignment with the broader trend. With gray wave 3 now progressing, the chart indicates further bullish momentum as this wave sequence develops, potentially pushing prices higher, consistent with typical wave 3 formations known for strong directional movement within Elliott Wave theory.
The wave cancel level, set at 4,494, serves as a critical invalidation point. If the Euro Stoxx 50 index falls below this level, the current Elliott Wave interpretation would no longer hold, suggesting a possible trend shift. However, remaining above this level supports the bullish trend, reinforcing the ongoing development of gray wave 3 within orange wave 3.
Summary
The Euro Stoxx 50 daily chart signals a bullish trend, with active gray wave 3 within orange wave 3 pointing to further upward momentum. With gray wave 2 considered complete, this configuration supports continued gains, provided the price remains above 4,494. This wave structure offers a positive outlook, indicating sustained upward movement in the bullish trend as gray wave 3 advances.
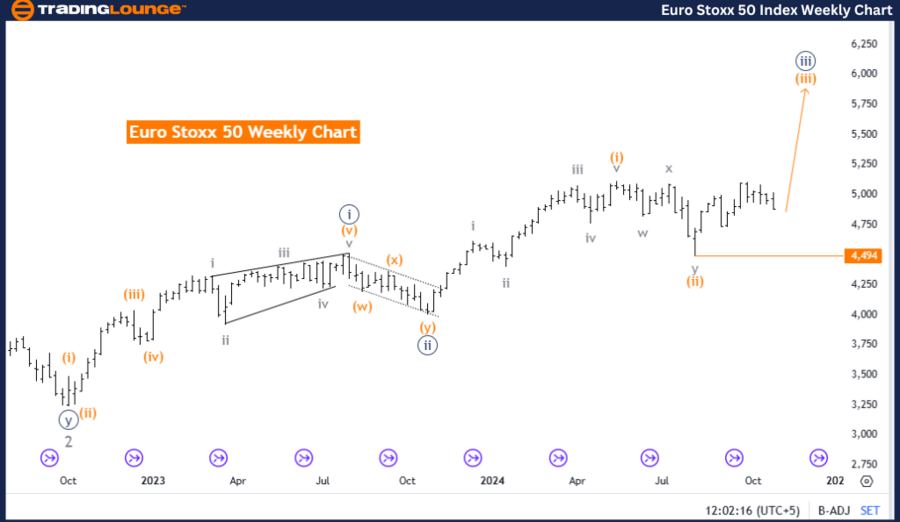
Euro Stoxx 50 Elliott Wave Analysis Trading Lounge Weekly Chart.
Euro Stoxx 50 Elliott Wave technical analysis
-
Function: Bullish Trend.
-
Mode: Impulsive.
-
Structure: Orange wave 3.
-
Position: Navy Blue Wave 3.
-
Next higher degree direction: Orange wave 3 (initiated).
Details:
Orange wave 2 appears complete, with orange wave 3 now progressing.
-
Wave cancel level: 4,494.
Euro Stoxx 50 weekly chart analysis
The weekly Elliott Wave analysis of the Euro Stoxx 50 suggests a bullish trend in an impulsive mode, currently positioned within orange wave 3 at the level of navy blue wave 3. This wave structure indicates that the recent phase of orange wave 2 has likely concluded, allowing orange wave 3 to begin forming in line with the bullish direction.
In Elliott Wave theory, wave 3 often features strong directional movement, typically driving prices further along the trend’s trajectory. The active development of orange wave 3 within navy blue wave 3 highlights the potential for increased upward movement, marking a robust phase in the broader bullish trend.
The wave cancel level is set at 4,494. If the index price falls below this level, the current Elliott Wave interpretation would become invalid, possibly indicating a shift in trend or a corrective phase. However, maintaining prices above this threshold supports the bullish outlook for orange wave 3 within navy blue wave 3.
Summary
The Euro Stoxx 50 weekly chart analysis reflects a bullish trend within an impulsive framework, with orange wave 3 now advancing following the completion of orange wave 2. This setup suggests a strong potential for further gains, contingent on the price remaining above 4,494. This configuration reinforces an upward trajectory, with orange wave 3 anticipated to sustain momentum within the ongoing bullish trend.
Technical analyst: Malik Awais.
Euro Stoxx 50 Elliott Wave technical analysis [Video]
Author

Peter Mathers
TradingLounge
Peter Mathers started actively trading in 1982. He began his career at Hoei and Shoin, a Japanese futures trading company.


