Euro Stoxx 50 index Elliott Wave technical analysis [Video]
![Euro Stoxx 50 index Elliott Wave technical analysis [Video]](https://editorial.fxstreet.com/images/Markets/Equities/Industries/Pharma/paracetamol-capsules-637435383109464449_XtraLarge.jpg)
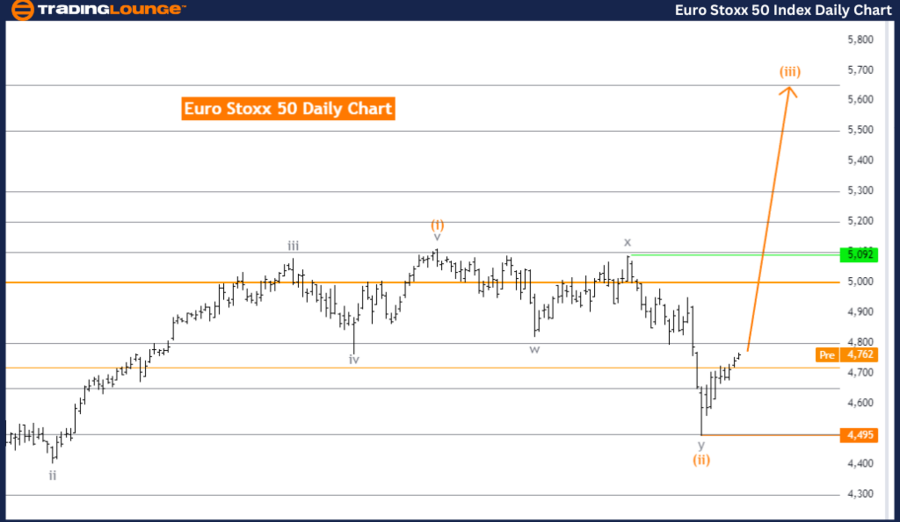
Euro Stoxx 50 Elliott Wave Analysis Trading Lounge Day Chart.
Euro Stoxx 50 Elliott Wave technical analysis
-
Function: Trend.
-
Mode: Impulsive.
-
Structure: Orange wave 3.
-
Position: Navy Blue Wave 3.
-
Direction next higher degrees: Orange wave 3 (started).
-
Details: Orange wave 2 of navy blue wave 3 appears complete. Orange wave 3 is now active. Wave Cancel invalid level: 4495.
The Euro Stoxx 50 daily chart currently shows a trend mode according to Elliott Wave analysis, with an impulsive wave structure developing. The primary focus is on orange wave 3, which signifies a strong and sustained upward movement in the market. This impulsive mode reflects the continuation of the broader trend, marked by a sequence of advancing waves.
The market's current position is within navy blue wave 3, a component of the larger orange wave 3 structure. The completion of orange wave 2 within this navy blue wave 3 suggests the end of the corrective phase, with the market now advancing within the impulsive wave of orange wave 3. This pattern is typical in Elliott Wave analysis, where, following a correction, the market resumes its dominant trend with increased momentum.
The direction at the next higher degree continues with orange wave 3, which has already commenced. This indicates that the market is expected to maintain its upward trajectory, progressing further within the impulsive wave structure. The start of orange wave 3 after the completion of orange wave 2 within navy blue wave 3 highlights that the market is in a strong and potentially extended trend phase.
The wave cancel invalid level is set at 4495. If the market breaks this level, it would invalidate the current wave count, suggesting a potential change in the market structure or an alternative wave formation.
In summary, the Euro Stoxx 50 daily chart is in an impulsive mode, with the market positioned within navy blue wave 3 as part of the larger orange wave 3 structure. The completion of orange wave 2 indicates the continuation of the trend, with orange wave 3 now active. The wave cancellation invalid level at 4495 is crucial for confirming the validity of this analysis.
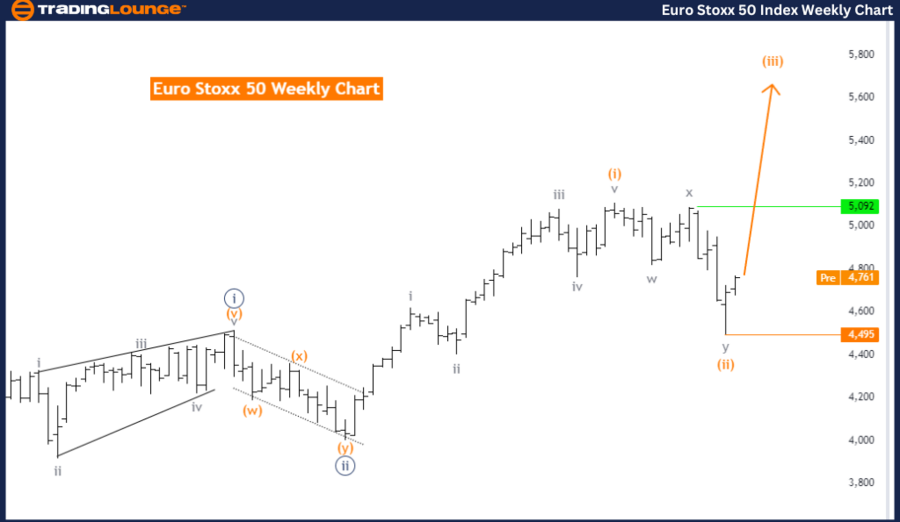
Euro Stoxx 50 Elliott Wave Analysis Trading Lounge Weekly Chart
Euro Stoxx 50 Elliott Wave technical analysis
-
Function: Trend.
-
Mode: Impulsive.
-
Structure: Orange wave 3.
-
Position: Navy Blue Wave 3.
-
Direction next higher degrees: Orange wave 3 (started).
-
Details: Orange wave 2 of navy blue wave 3 appears complete. Orange wave 3 is now active. Wave Cancel invalid level: 4495.
The Euro Stoxx 50 weekly chart, based on Elliott Wave analysis, is currently in a trend mode with an impulsive structure. The primary wave structure being analyzed is orange wave 3, which signals a strong upward movement in the market. This impulsive trend indicates that the market is in an expansion phase, characterized by upward momentum and continuation of the prevailing trend.
The current market position is within navy blue wave 3, which is a component of the larger orange wave 3 structure. The completion of orange wave 2 within navy blue wave 3 suggests that a corrective phase has ended, and the market is now advancing within the impulsive wave of orange wave 3. This pattern is consistent with Elliott Wave theory, where corrections are typically followed by renewed movement in the direction of the dominant trend.
The next higher degree direction is also aligned with orange wave 3, which has already commenced. This suggests that the market is expected to maintain its upward trajectory, progressing further within the impulsive wave structure. The initiation of orange wave 3 following the completion of orange wave 2 within navy blue wave 3 indicates that the market is in a strong trend phase, likely to extend further.
The wave cancel invalid level is set at 4495, serving as a critical threshold. If the market were to move below this level, it would invalidate the current wave count and suggest a potential change in the market structure or an alternative wave pattern.
In summary, the Euro Stoxx 50 weekly chart is in an impulsive trend mode, with the market positioned within navy blue wave 3 as part of the larger orange wave 3 structure. The completion of orange wave 2 points to the continuation of the trend, with orange wave 3 now in progress. The wave cancel invalid level at 4495 is essential for confirming this analysis.
Technical analyst: Malik Awais.
Euro Stoxx 50 Elliott Wave technical analysis [Video]
Author

Peter Mathers
TradingLounge
Peter Mathers started actively trading in 1982. He began his career at Hoei and Shoin, a Japanese futures trading company.


