Euro Stoxx 50 Index Elliott Wave technical analysis [Video]
![Euro Stoxx 50 Index Elliott Wave technical analysis [Video]](https://editorial.fxstreet.com/images/TechnicalAnalysis/ChartPatterns/Chartism/stock-market-ticker-board-black-17803444_XtraLarge.jpg)
Euro Stoxx 50 Elliott Wave technical analysis
Function: Counter Trend.
Mode: Corrective.
Structure: Orange wave 4.
Position: Navy blue wave 3.
Direction next higher degrees: Orange wave 5.
Details: Orange wave 4 remains in play as a sideways movement. Wave Cancel invalid level: 4618.
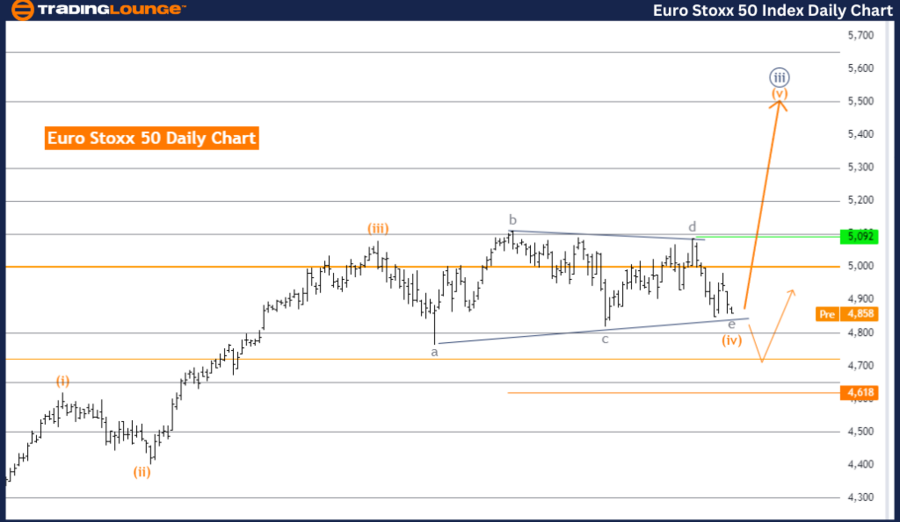
The Euro Stoxx 50 Elliott Wave Analysis on the day chart indicates that the market is currently in a counter-trend phase. This phase is characterized by a corrective mode, suggesting a temporary pause or reversal in the prevailing trend. The specific wave structure being analyzed is orange wave 4, positioned within navy blue wave 3. This means the market is in the fourth wave of a larger wave sequence, typically involving consolidation or a corrective movement before the final leg of the trend.
The analysis suggests that the next higher degree direction is orange wave 5. This indicates that after the completion of the current corrective phase (orange wave 4), the market is expected to transition into orange wave 5, resuming the primary trend direction and likely leading to further price increases.
Detailed observations indicate that orange wave 4 is still developing and is unfolding in a sideways pattern. This implies the market is currently in a consolidation phase with limited directional movement, characteristic of a corrective wave that moves sideways rather than trending strongly in one direction.
A crucial aspect of this analysis is the wave cancellation invalid level, set at 4618. This level serves as a critical threshold for validating the current wave structure. If the market price falls below this point, it would invalidate the current wave analysis, indicating that the expected wave pattern is no longer valid and would require reassessment.
In summary, the Euro Stoxx 50 day chart analysis shows the market in a corrective counter-trend phase within orange wave 4, positioned in navy blue wave 3. The market is currently consolidating sideways, and after this phase completes, it is expected to transition into orange wave 5, resuming the primary trend direction. The wave cancel invalid level is 4618, serving as a critical validation point for the current wave analysis.
 Euro Stoxx 50 Elliott Wave daily chart
Euro Stoxx 50 Elliott Wave weekly chart
Function: Counter Trend.
Mode: Corrective.
Structure: Orange wave 4.
Position: Navy blue wave 3.
Direction next higher degrees: Orange wave 5.
Details: Orange wave 4 is still unfolding as a sideways movement. Wave Cancel invalid level: 4618.
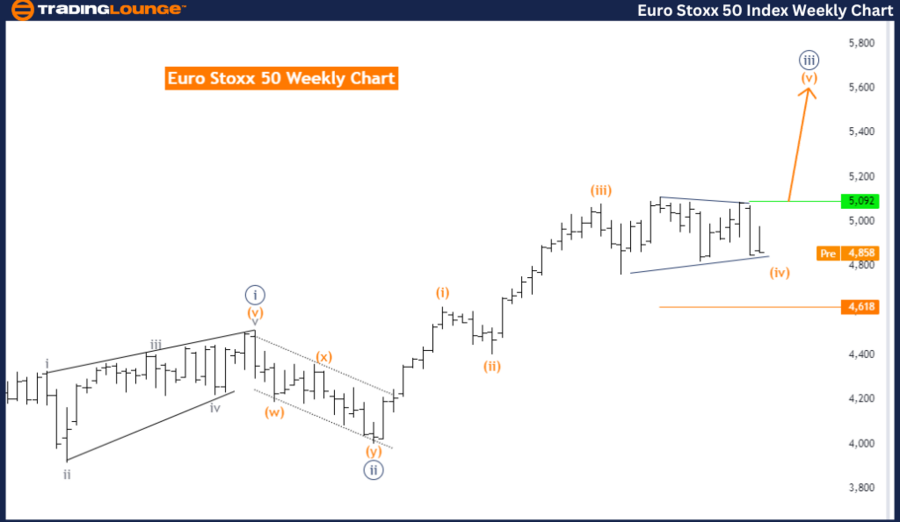
The Euro Stoxx 50 Elliott Wave Analysis on the weekly chart shows that the market is currently in a counter-trend phase. This phase is classified as corrective, indicating a temporary pause or reversal within a larger trend. The specific wave structure under analysis is orange wave 4, positioned within navy blue wave 3. This positioning suggests the market is in the fourth wave of a larger wave sequence, typically involving a corrective or consolidative movement.
The analysis predicts that the next higher degree direction will be orange wave 5. This suggests that after the completion of the current corrective phase (orange wave 4), the market is expected to transition into orange wave 5, resuming the main trend and potentially leading to further upward movement in prices.
A key detail in the analysis is that orange wave 4 is still in progress, manifesting as a sideways movement. This sideways movement indicates that the market is in a consolidation phase, with limited directional momentum, characteristic of a corrective wave that does not strongly trend in either direction but instead moves in a horizontal pattern.
An important aspect to note is the wave cancel invalid level, set at 4618. This level is crucial as it serves as a validation point for the current wave structure. If the market price drops below this level, it would invalidate the current wave analysis, signaling that the expected wave pattern is no longer applicable and that the analysis would need revision.
In summary, the Euro Stoxx 50 weekly chart analysis indicates the market is in a corrective counter-trend phase within orange wave 4, situated in navy blue wave 3. The market is consolidating sideways, and upon completion of this phase, it is expected to move into orange wave 5, resuming the primary trend direction. The wave cancel invalid level is 4618, serving as a critical threshold for validating the current wave analysis.
Euro Stoxx 50 Index Elliott Wave technical analysis [Video]
Author

Peter Mathers
TradingLounge
Peter Mathers started actively trading in 1982. He began his career at Hoei and Shoin, a Japanese futures trading company.


