Euro Stoxx 50 Elliott Wave technical analysis [Video]
![Euro Stoxx 50 Elliott Wave technical analysis [Video]](https://editorial.fxstreet.com/images/Markets/Equities/stock-market-research-9338010_XtraLarge.jpg)
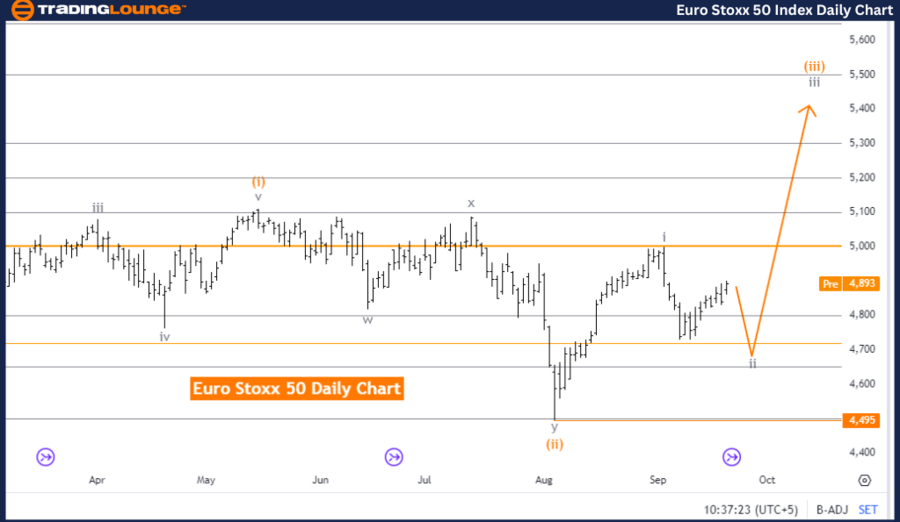
Euro Stoxx 50 Elliott Wave Analysis Trading Lounge Day Chart,
Euro Stoxx 50 Elliott Wave technical analysis
-
Function: Counter Trend.
-
Mode: Corrective.
-
Structure: Gray Wave 2.
-
Position: Orange Wave 3.
-
Direction next higher degrees: Gray Wave 3.
-
Details: Gray wave 1 appears to have completed. Now gray wave 2 of orange wave 3 is underway.
-
Wave cancel invalid level: 4495
The Elliott Wave analysis for the Euro Stoxx 50 on the daily chart indicates that the index is currently in a counter-trend phase, signaling a temporary move against the prevailing market direction. The mode is corrective, meaning the market is undergoing a pullback or consolidation within the larger trend.
The focus of the analysis is on gray wave 2, a correction in the context of the broader wave structure. Gray wave 1 is deemed complete, and now gray wave 2 of orange wave 3 is active. This means the market is currently correcting within the broader impulsive structure.
Once this corrective phase, represented by gray wave 2, is finished, the expectation is for the index to resume its upward movement in orange wave 3, which is part of the larger impulsive sequence.
The next higher degree of direction points toward gray wave 3, indicating that once this correction (gray wave 2) ends, the market is expected to move higher in line with the larger trend. This suggests that after gray wave 2 concludes, orange wave 3 will drive the market upwards again.
The invalidation level for this Elliott Wave count is 4495. As long as the index stays above this level, the current wave count holds, and further upward movement within the larger trend is anticipated.
In summary: The Euro Stoxx 50 is in a corrective phase (gray wave 2) within a larger upward trend. Once the correction finishes, the market is expected to continue rising in orange wave 3. The analysis stays valid as long as the index remains above the 4495 level.
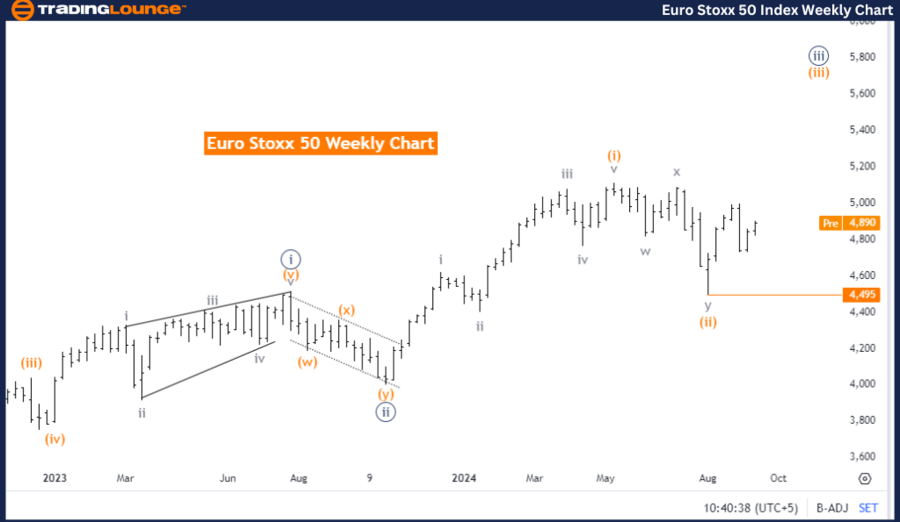
Euro Stoxx 50 Elliott Wave Analysis Trading Lounge Weekly Chart,
Euro Stoxx 50 Elliott Wave technical analysis
-
Function: Bullish Trend.
-
Mode: Impulsive.
-
Structure: Orange Wave 3.
-
Position: Navy Blue Wave 3.
-
Direction next lower degrees: Orange Wave 4.
-
Details: Orange wave 2 is considered complete. Now orange wave 3 of 3 is active.
-
Wave cancel invalid level: 4495.
The weekly Elliott Wave analysis for the Euro Stoxx 50 suggests that the index is in a bullish trend, indicating upward market movement. The current mode is impulsive, reflecting a strong wave structure in alignment with the broader trend. The key structure under analysis is orange wave 3, a significant wave in the upward impulsive pattern.
According to this analysis, orange wave 2 is complete, and now the market is progressing through orange wave 3 of 3. This marks a strong upward phase, with wave 3 typically being one of the most extended and powerful waves according to Elliott Wave theory. The market's current position is identified as navy blue wave 3, further confirming the ongoing impulsive movement upward.
The next lower degree suggests that after the current wave 3 finishes, orange wave 4 (a corrective wave) may follow. However, the immediate focus remains on wave 3, which continues driving the market higher.
The wave invalidation level is set at 4495. As long as the index remains above this level, the current Elliott Wave count is valid, and the bullish structure is expected to continue.
In summary: The Euro Stoxx 50 is currently in an impulsive bullish phase, with orange wave 3 leading the market higher. Orange wave 2 has completed, and orange wave 3 is in motion, suggesting further upside potential. This analysis holds as long as the index remains above the 4495 level. After wave 3 concludes, a corrective phase (orange wave 4) could follow.
Technical analyst: Malik Awais.
Euro Stoxx 50 Elliott Wave technical analysis [Video]
Author

Peter Mathers
TradingLounge
Peter Mathers started actively trading in 1982. He began his career at Hoei and Shoin, a Japanese futures trading company.


