|

EUR/USD technical analysis: Fiber breaks above 1.1263 within its daily range

  • EUR/USD breaks above 1.1263 opening the doors to 1.1274 resistance.
  • The level to beat for sellers is 1.1245 followed by 1.1220.
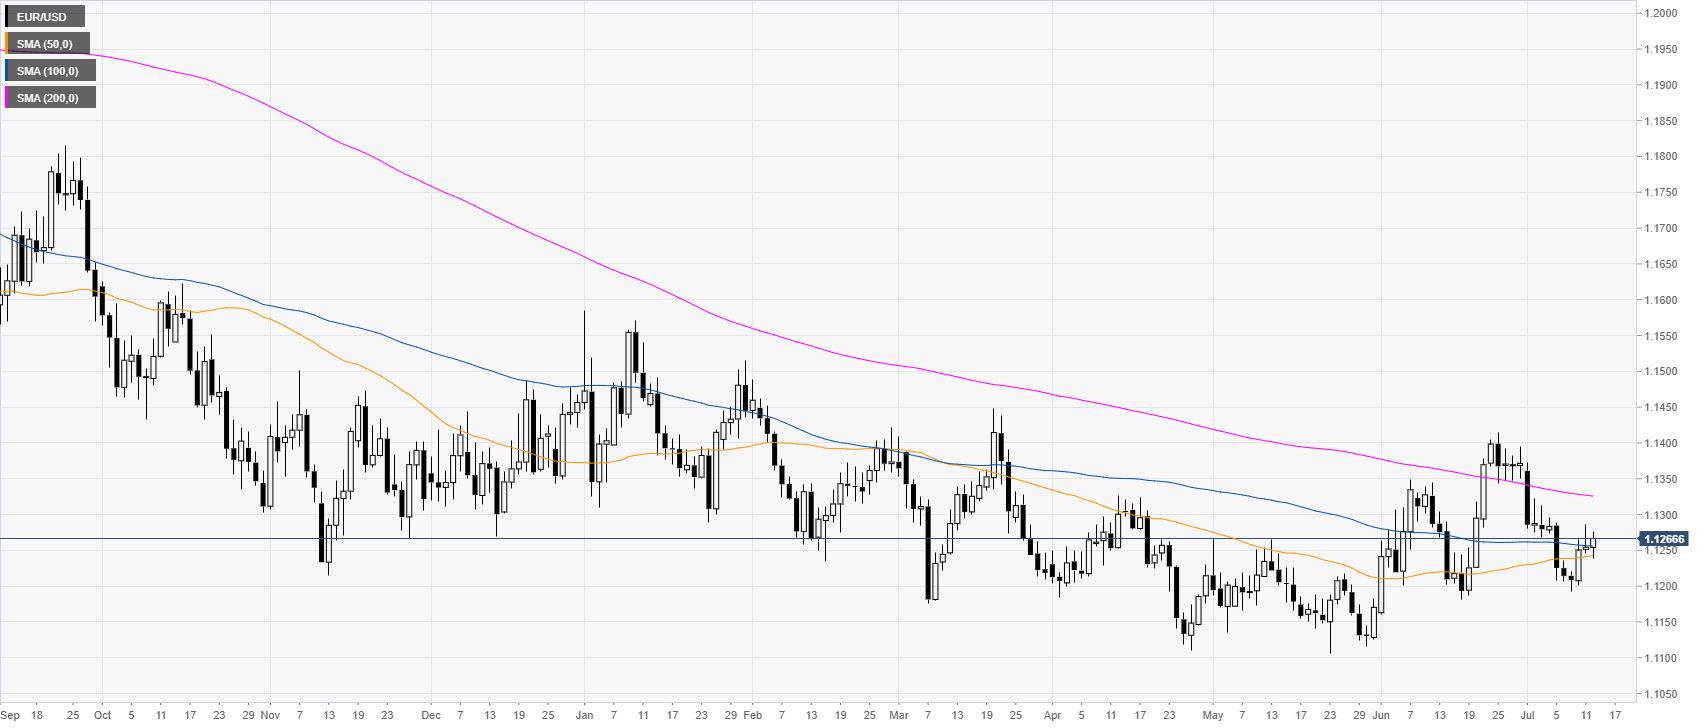
EUR/USD daily chart

EUR/USD is in a bear trend below the 1.1300 handle and its 200-day simple moving averages (DSMAs). The market is trading just above the 100 SMA.

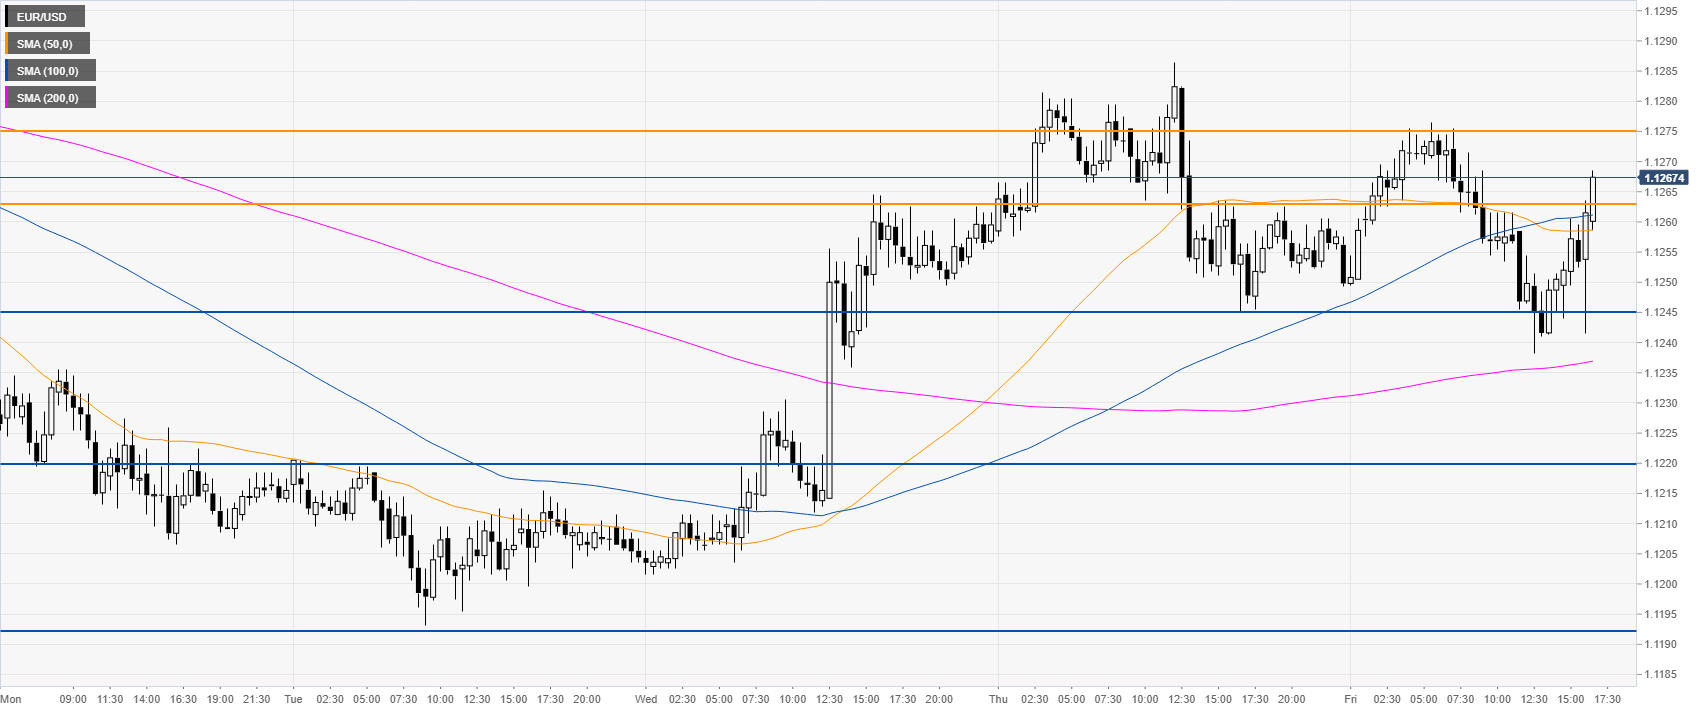
EUR/USD 4-hour chart

EUR/USD broke above 1.1263 resistance opening the doors to 1.1274 resistance, according to the Technical Confluences Indicator.


EUR/USD 30-minute chart

EUR/USD is trading above its main SMAs suggesting bullish momentum in the near term. If bears want to retake control they would need a beak below 1.1245 support followed by 1.1220.


Additional key levels

EUR/USD

Overview
Today last price1.1261
Today Daily Change0.0007
Today Daily Change %0.06
Today daily open1.1254
 
Trends
Daily SMA201.1298
Daily SMA501.123
Daily SMA1001.1262
Daily SMA2001.1341
Levels
Previous Daily High1.1286
Previous Daily Low1.1245
Previous Weekly High1.1373
Previous Weekly Low1.1207
Previous Monthly High1.1414
Previous Monthly Low1.116
Daily Fibonacci 38.2%1.1271
Daily Fibonacci 61.8%1.1261
Daily Pivot Point S11.1237
Daily Pivot Point S21.122
Daily Pivot Point S31.1196
Daily Pivot Point R11.1279
Daily Pivot Point R21.1303
Daily Pivot Point R31.132

Author

Flavio Tosti

Flavio Tosti

Independent Analyst


More from Flavio Tosti
Share:

Editor's Picks

EUR/USD stays depressed near 1.1850 ahead of German ZEW

EUR/USD remains in the red near 1.1850 in the European session on Tuesday. A broad US Dollar bullish consolidation combined with a softer risk tone keep the pair undermined ahead of the German ZEW sentiment survey. 

GBP/USD drops below 1.3600 after weak UK jobs report

GBP/USD is seeing a fresh selling wave, giving up the 1.3600 level in Tuesday's European trading. The United Kingdom employment data showed worsening labor market conditions, bolstering bets for a BoE interest rate cut next month. This narrative is weighing heavily on the Pound Sterling. 

Gold adds to intraday losses as risk-on mood offsets dovish Fed and subdued USD demand

Gold attracts some follow-through selling for the second straight day and dives to over a one-week low, around the $4,858 area, heading into the European session on Tuesday. The commodity, however, quickly recovers to the $4,900 mark as traders opt to await more cues about the US Federal Reserve's (Fed) rate-cut path before placing fresh directional bets.

Pi Network rallies ahead of its first anniversary

Pi Network trades above $0.1800 at the time of writing on Tuesday, recording nearly 5% gains so far. On-chain data indicate that large wallet investors, commonly known as whales, have accumulated approximately 4 million PI tokens over the last 24 hours.

The week ahead: Key inflation readings and why the AI trade could be overdone

It is likely to be a quiet start to the week, with US markets closed on Monday for Presidents Day. European markets are higher across the board and gold is clinging to the $5,000 level after the tamer than expected CPI report in the US reduced haven flows to precious metals.

Stellar mixed sentiment caps recovery

Stellar price remains under pressure, trading at $0.170 on Tuesday after failing to close above the key resistance on Sunday. The derivatives metric supports the bearish sentiment, with XLM’s short bets rising among traders and funding rates turning negative.