|

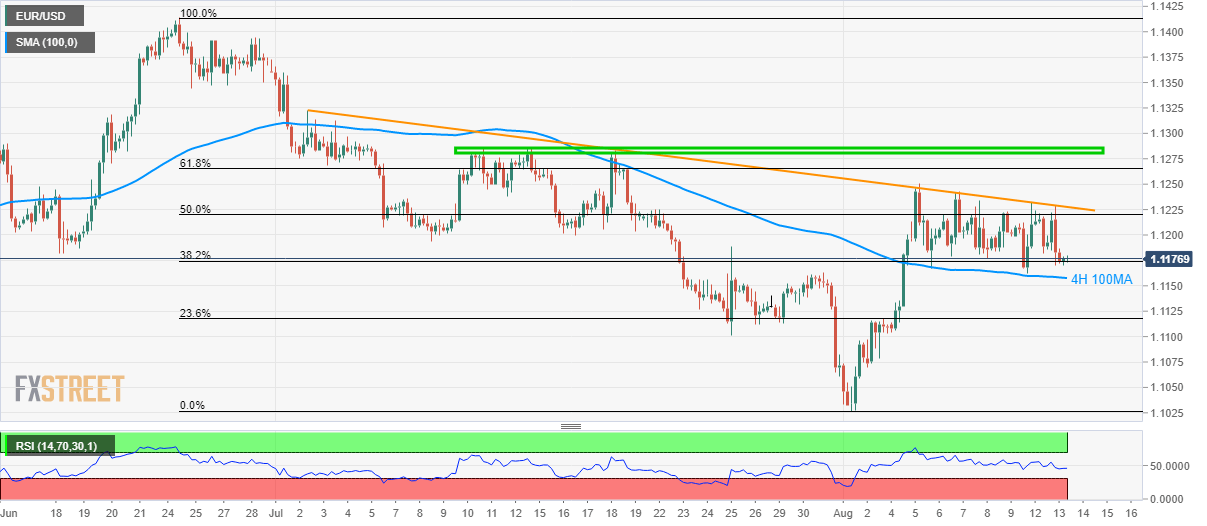
EUR/USD technical analysis: Upside capped by 6-week long descending trend-line

  • EUR/USD aims to revisit 4H 100MA after taking another U-turn from near-term resistance-line.
  • While 1.1283/87 can please buyers during upside break, 23.6% Fibonacci retracement can lure during post-1.1158 declines.

Having registered another failure to cross six-week-old descending trend-line, EUR/USD trades near 1.1180 during Wednesday morning in Asia.

100-bar moving average on the four-hour chart (4H 100MA) becomes the immediate support to watch, at 1.1158 now, a break of which can recall 23.6% Fibonacci retracement of June – August south-run, around 1.1118.

It should, however, be noted that the pair’s decline below 1.1118 might not refrain from challenging 1.1070 and 1.1030/27 during further weakness.

Alternatively, pair’s run-up beyond 1.1128 resistance-line can take a halt at 61.8% Fibonacci retracement level of 1.1265 ahead of confronting 1.1283/87 area comprising mid-July tops.

EUR/USD 4-hour chart

Trend: Sideways

    1. R3 1.127 
    2. R2 1.125 
    3. R1 1.1211 
  1. PP 1.119
    1. S1  1.1151
    2. S2  1.1131
    3. S3  1.1092

Author

Anil Panchal

Anil Panchal

FXStreet

Anil Panchal has nearly 15 years of experience in tracking financial markets. With a keen interest in macroeconomics, Anil aptly tracks global news/updates and stays well-informed about the global financial moves and their implications.

More from Anil Panchal
Share:

Editor's Picks

EUR/USD treads water above 1.1850 amid thin trading

EUR/USD stays defensive but holds 1.1850 amid quiet markets in the European hours on Monday.  The US Dollar is struggling for direction due to thin liquidity conditions as US markets are closed in observance of Presidents' Day. 

GBP/USD flat lines as traders await key UK and US macro data

GBP/USD kicks off a new week on a subdued note and oscillates in a narrow range near 1.365 in Monday's European trading. The mixed fundamental backdrop warrants some caution for aggressive traders as the market focus now shifts to this week's important releases from the UK and the US.

Gold sticks to intraday losses; lacks follow-through

Gold remains depressed through the early European session on Monday, though it has managed to rebound from the daily trough and currently trades around the $5,000 psychological mark. Moreover, a combination of supporting factors warrants some caution for aggressive bearish traders, and before positioning for deeper losses.

Bitcoin, Ethereum and Ripple consolidate within key ranges as selling pressure eases

Bitcoin and Ethereum prices have been trading sideways within key ranges following the massive correction. Meanwhile, XRP recovers slightly, breaking above the key resistance zone. The top three cryptocurrencies hint at a potential short-term recovery, with momentum indicators showing fading bearish signs.

Global inflation watch: Signs of cooling services inflation

Realized inflation landed close to expectations in January, as negative base effects weighed on the annual rates. Remaining sticky inflation is largely explained by services, while tariff-driven goods inflation remains limited even in the US.

Ripple Price Forecast: XRP potential bottom could be in sight

Ripple edges up above the intraday low of $1.35 at the time of writing on Friday amid mixed price actions across the crypto market. The remittance token failed to hold support at $1.40 the previous day, reflecting risk-off sentiment amid a decline in retail and institutional sentiment.