|

EUR/USD Technical Analysis: Euro rising to 1.1300 figure post-US data
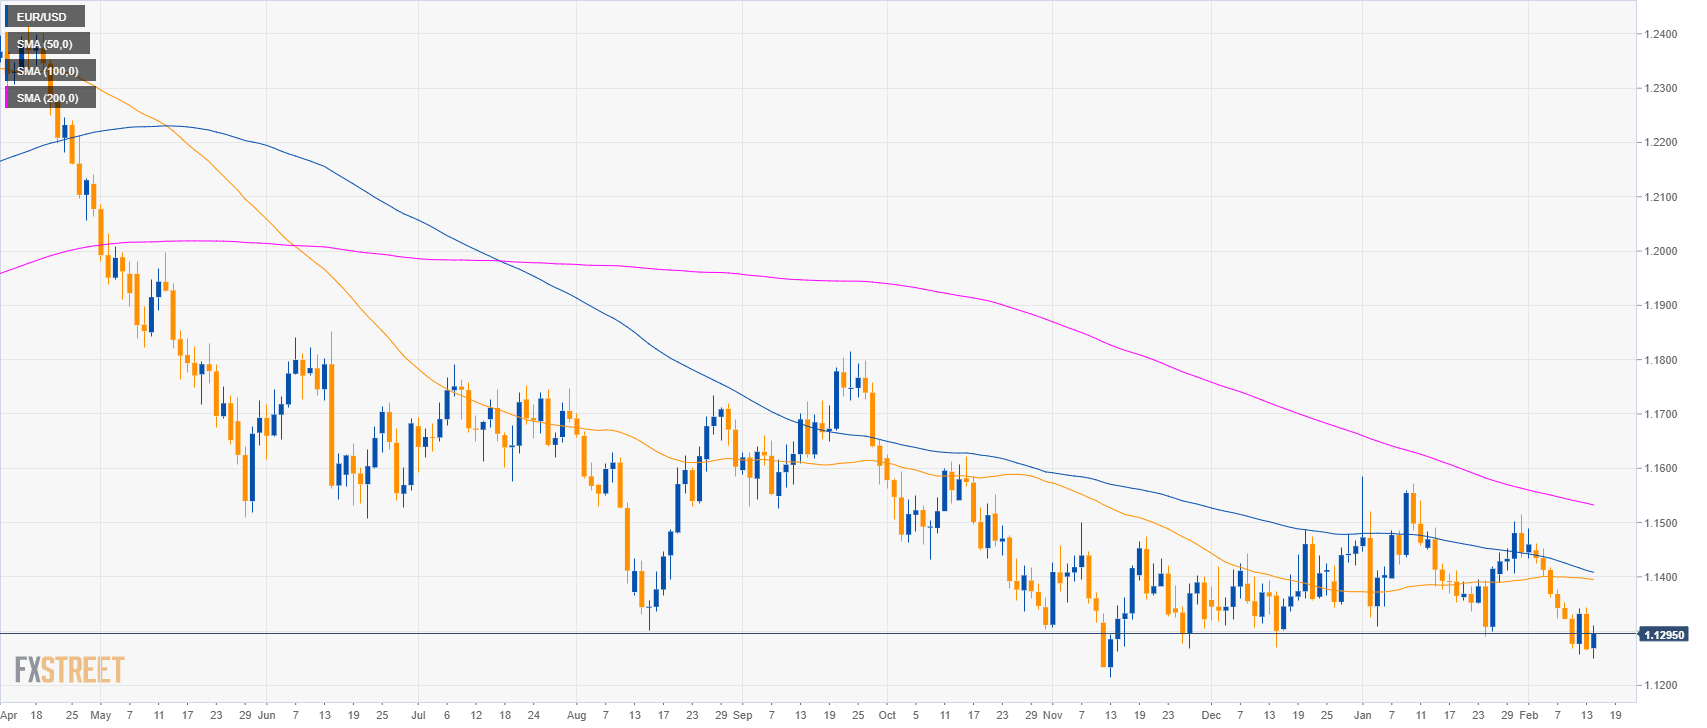
EUR/USD daily chart

  • EUR/USD is trading in a bear trend below the 200-day simple moving average (SMA).
  • The Retail Sales ex Autos (MoM) for December disappointed greatly with -1.8% versus 0.1% expected by analysts.

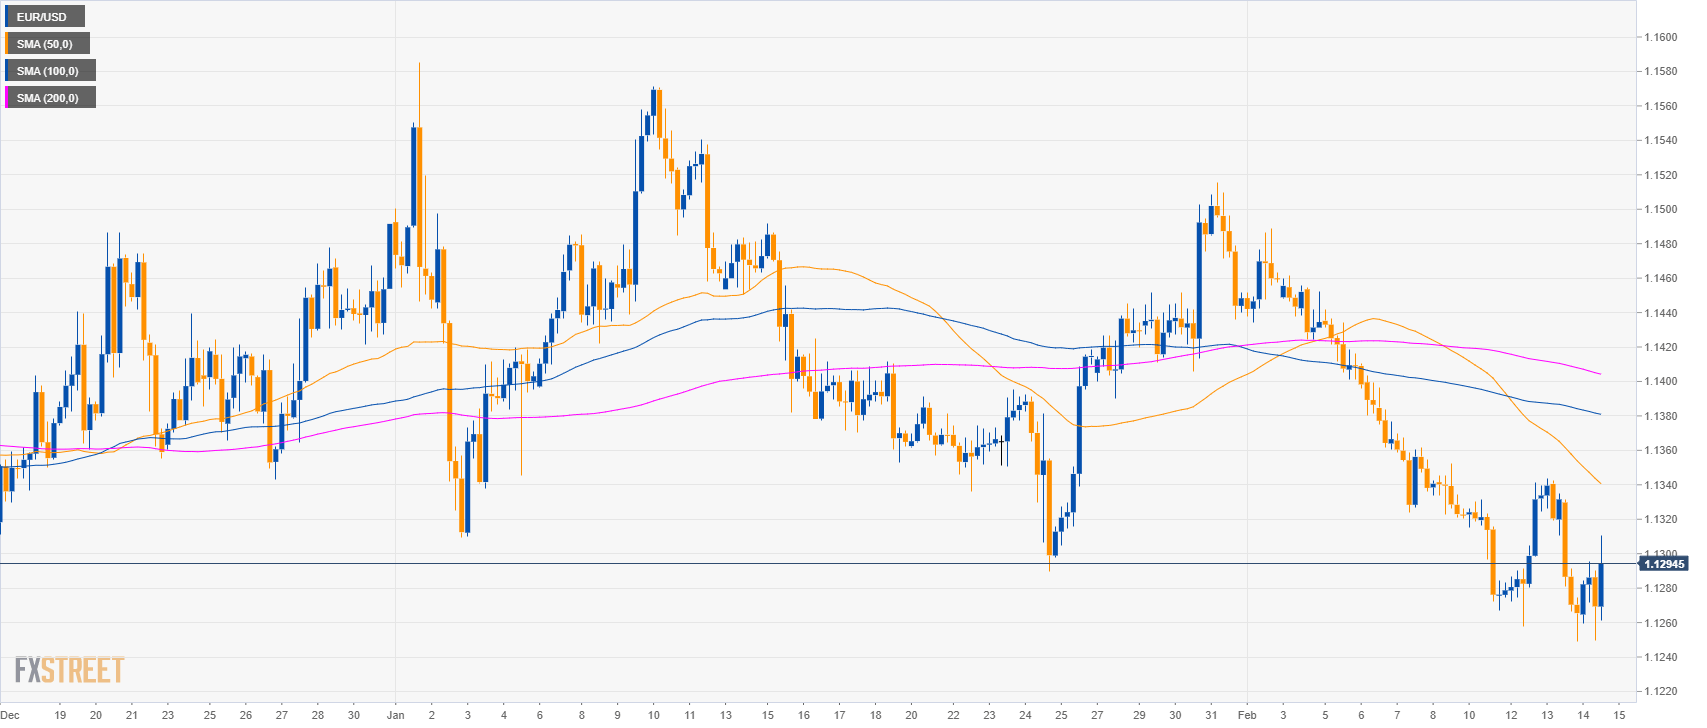
EUR/USD 4-hour chart

  • EUR/USD is trading below its main SMAs suggesting bearish momentum in the medium-term.

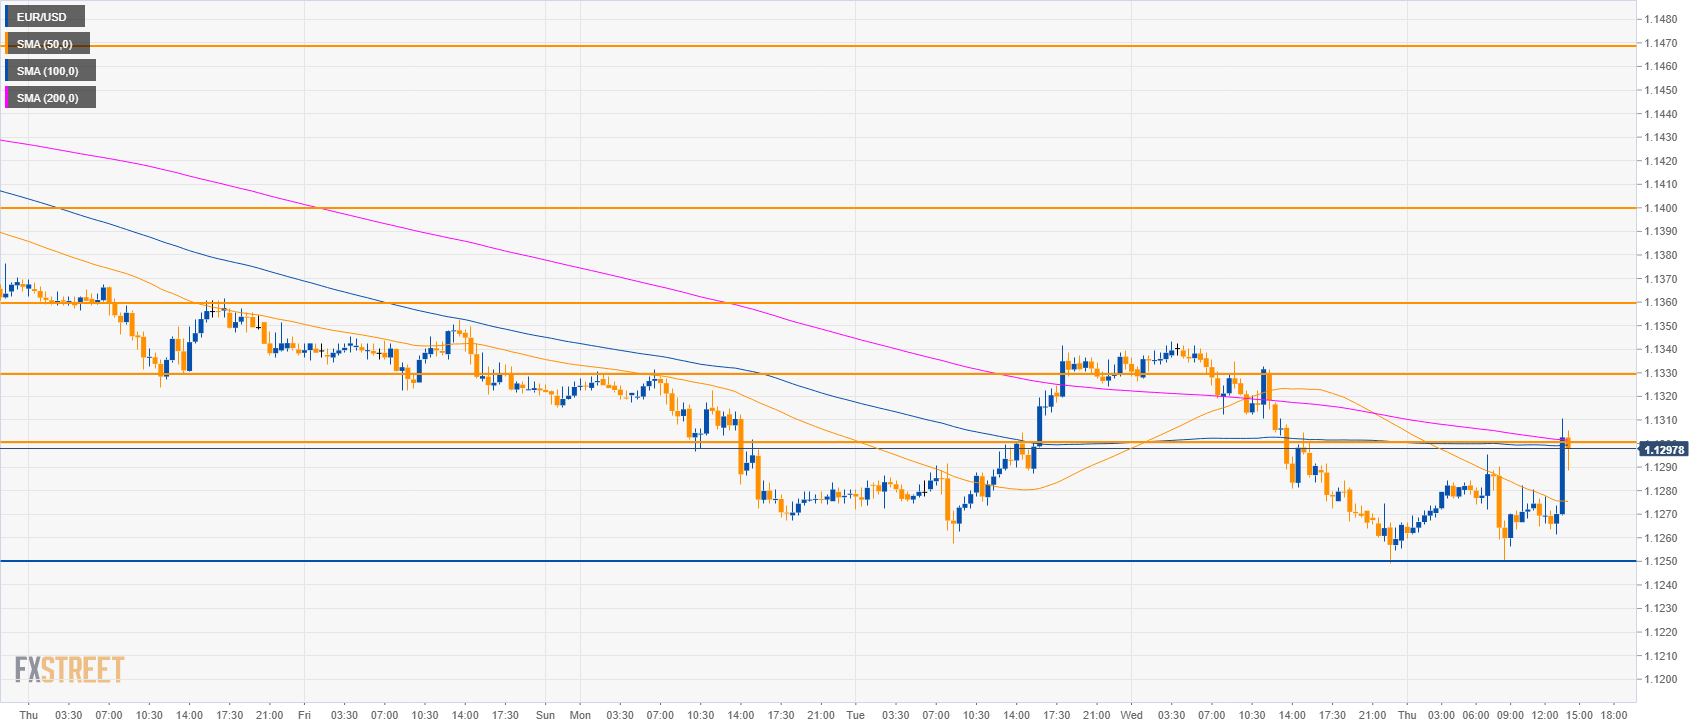
EUR/USD 30-minute chart

  • EUR/USD is trading between the 50 and 200 SMA suggesting a sideways market, therefore signalling caution for sellers.
  • Support is seen at 1.1250 and 1.1215, the 2018 low. 
  • To the upside, resistance is seen at 1.1300, 1.1330 and 1.1400 figure.

Additional key levels

EUR/USD

Overview:
    Today Last Price: 1.1303
    Today Daily change: 37 pips
    Today Daily change %: 0.33%
    Today Daily Open: 1.1266
Trends:
    Daily SMA20: 1.1379
    Daily SMA50: 1.1397
    Daily SMA100: 1.1412
    Daily SMA200: 1.1535
Levels:
    Previous Daily High: 1.1344
    Previous Daily Low: 1.1264
    Previous Weekly High: 1.1462
    Previous Weekly Low: 1.132
    Previous Monthly High: 1.1586
    Previous Monthly Low: 1.1289
    Daily Fibonacci 38.2%: 1.1294
    Daily Fibonacci 61.8%: 1.1313
    Daily Pivot Point S1: 1.1239
    Daily Pivot Point S2: 1.1212
    Daily Pivot Point S3: 1.116
    Daily Pivot Point R1: 1.1319
    Daily Pivot Point R2: 1.1371
    Daily Pivot Point R3: 1.1398

Author

Flavio Tosti

Flavio Tosti

Independent Analyst


More from Flavio Tosti
Share:

Editor's Picks

EUR/USD treads water above 1.1850 amid thin trading

EUR/USD stays defensive but holds 1.1850 amid quiet markets in the European hours on Monday.  The US Dollar is struggling for direction due to thin liquidity conditions as US markets are closed in observance of Presidents' Day. 

GBP/USD flat lines as traders await key UK and US macro data

GBP/USD kicks off a new week on a subdued note and oscillates in a narrow range near 1.365 in Monday's European trading. The mixed fundamental backdrop warrants some caution for aggressive traders as the market focus now shifts to this week's important releases from the UK and the US.

Gold slides below $5,000 amid USD uptick and positive risk tone; downside seems limited

Gold attracts fresh sellers at the start of a new week and reverses a part of Friday's strong move up of over $150 from sub-$4,900 levels. The commodity slides back below the $5,000 psychological mark during the Asian session, though the downside potential seems limited amid a combination of supporting factors.

Bitcoin, Ethereum and Ripple consolidate within key ranges as selling pressure eases

Bitcoin and Ethereum prices have been trading sideways within key ranges following the massive correction. Meanwhile, XRP recovers slightly, breaking above the key resistance zone. The top three cryptocurrencies hint at a potential short-term recovery, with momentum indicators showing fading bearish signs.

Global inflation watch: Signs of cooling services inflation

Realized inflation landed close to expectations in January, as negative base effects weighed on the annual rates. Remaining sticky inflation is largely explained by services, while tariff-driven goods inflation remains limited even in the US.

Ripple Price Forecast: XRP potential bottom could be in sight

Ripple edges up above the intraday low of $1.35 at the time of writing on Friday amid mixed price actions across the crypto market. The remittance token failed to hold support at $1.40 the previous day, reflecting risk-off sentiment amid a decline in retail and institutional sentiment.