|

EUR/USD technical analysis: Euro records its largest daily advance since January 2019

  • EUR/USD reaches its highest level in two weeks as the trade war damages the US Dollar.
  • The level to beat for bulls are seen at the 1.1220 and 1.1255 levels.
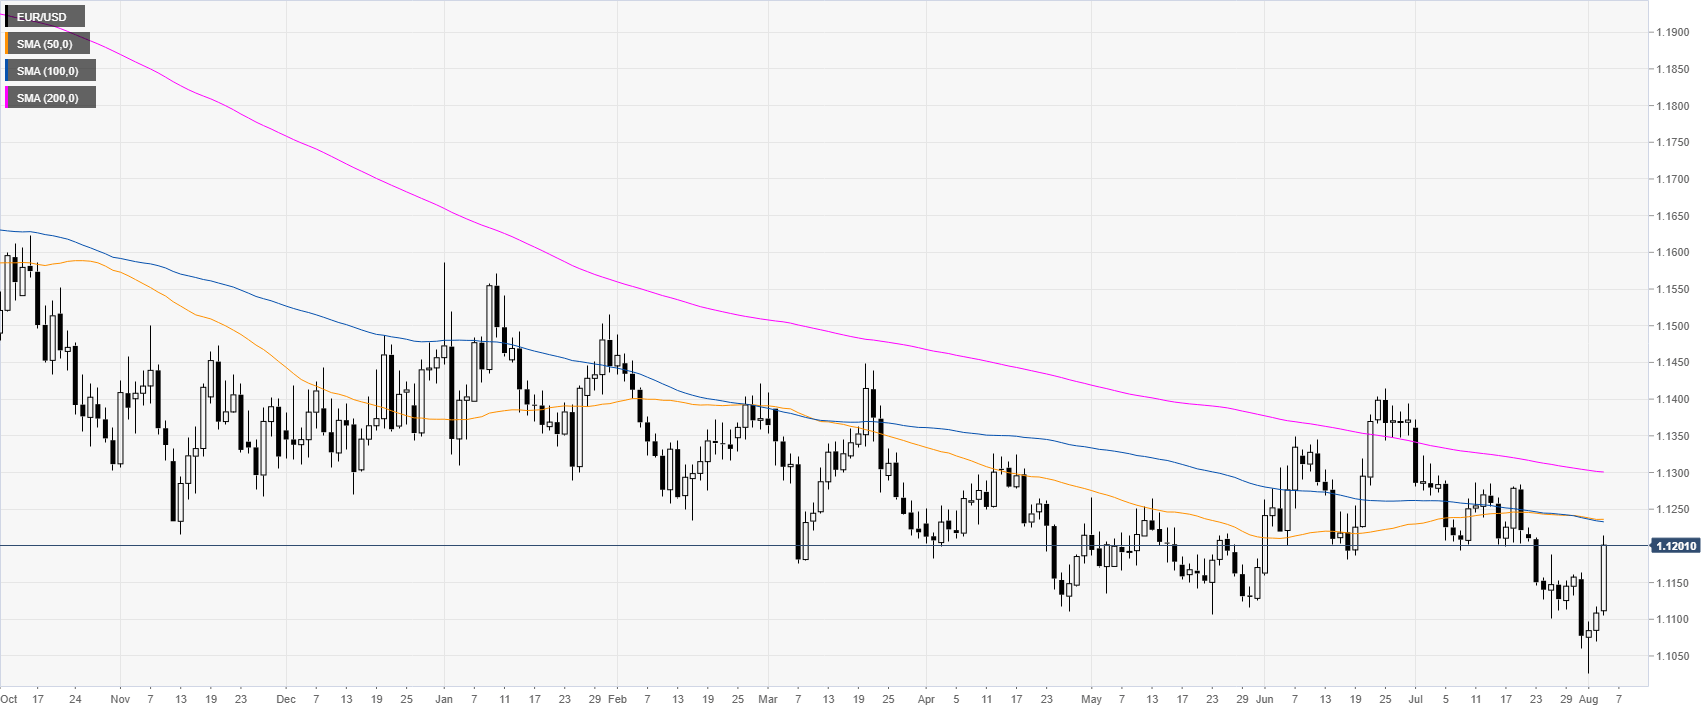


EUR/USD daily chart

 
EUR/USD is reversing up from the 2019 low as the market is trading in a bear trend below its main daily simple moving averages (DSMAs). The Federal Reserve is now expected to cut rates more aggressively to counteract the damage of the US-China trade war.
 

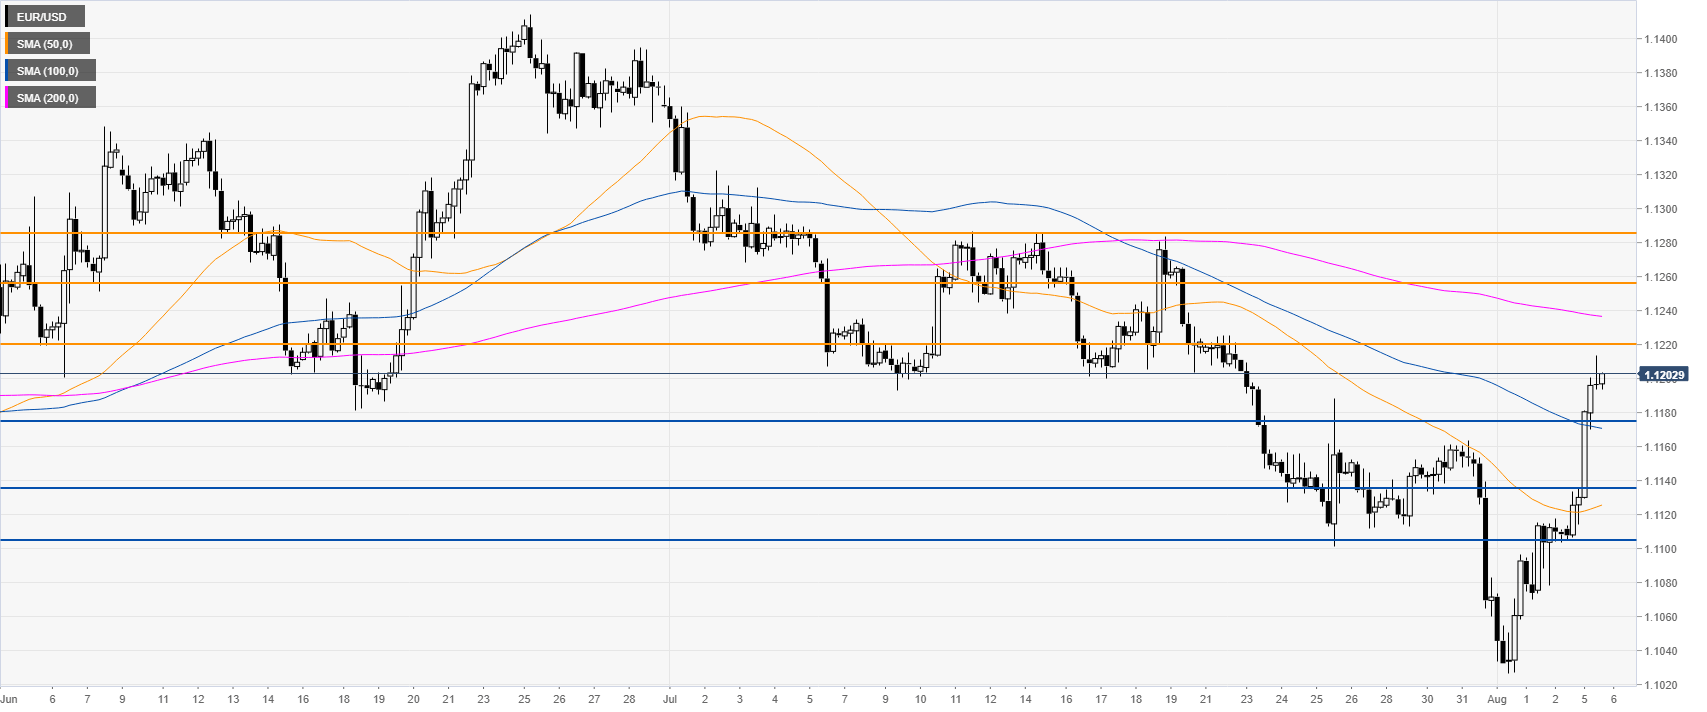
EUR/USD 4-hour chart

 
EUR/USD broke above the 1.1174 resistance and the 100 SMA. The market is set to keep appreciating towards 1.1220, 1.1255 and 1.1285 resistances, according to the Technical Confluences Indicator

EUR/USD 30-minute chart

 
This Monday the market recorded its largest daily advance since January 2019 as the bulls have been relentless. Support can be seen near 1.1174, 1.1135, 1.1121 and 1.1100 levels.
 

Additional key levels

EUR/USD

Overview
Today last price1.1203
Today Daily Change0.0095
Today Daily Change %0.86
Today daily open1.1108
 
Trends
Daily SMA201.1187
Daily SMA501.1236
Daily SMA1001.1234
Daily SMA2001.1301
Levels
Previous Daily High1.1118
Previous Daily Low1.107
Previous Weekly High1.1164
Previous Weekly Low1.1027
Previous Monthly High1.1373
Previous Monthly Low1.106
Daily Fibonacci 38.2%1.1099
Daily Fibonacci 61.8%1.1088
Daily Pivot Point S11.108
Daily Pivot Point S21.1051
Daily Pivot Point S31.1032
Daily Pivot Point R11.1127
Daily Pivot Point R21.1146
Daily Pivot Point R31.1175

Author

Flavio Tosti

Flavio Tosti

Independent Analyst


More from Flavio Tosti
Share:

Editor's Picks

EUR/USD stays well offered below 1.1800

The selling pressure on EUR/USD is picking up pace, with the pair slipping decisively below the key 1.1800 level and sliding to fresh two week lows as Wednesday’s session draws to a close. The move lower comes as the US Dollar finds renewed strength after the latest round of US data and the release of the FOMC Minutes. Next of note on the docket will be the US weekly Initial Jobless Claims.
 

GBP/USD reaches multi-day lows near 1.3500

GBP/USD reverses its initial upside momentum and is now adding to previous declines, approaching the 1.3500 region on Wednesday. Cable’s downtick comes on the back of decent gains in the Greenback and easing UK inflation figures, which seem to have reinforced the case for a BoE rate cut in March.

Gold battle to regain $5,000 continues

Gold is back on the front foot on Wednesday, shaking off part of the early week softness and challenging two-day highs near the $5,000 mark per troy ounce. The move comes ahead of the FOMC Minutes and is unfolding despite an intense rebound in the US Dollar.

Bitcoin has found or is near a bottom, extended consolidation to follow: K33

Bitcoin (BTC) is nearing or has already established a bottom, which could be followed by a sustained period of slow price movement, according to K33.

Mixed UK inflation data no gamechanger for the Bank of England

Food inflation plunged in January, but service sector price pressure is proving stickier. We continue to expect Bank of England rate cuts in March and June. The latest UK inflation read is a mixed bag for the Bank of England, but we doubt it drastically changes the odds of a March rate cut.

Sui extends sideways action ahead of Grayscale’s GSUI ETF launch

Sui is extending its downtrend for the second consecutive day, trading at 0.95 at the time of writing on Wednesday. The Layer-1 token is down over 16% in February and approximately 34% from the start of the year, aligning with the overall bearish sentiment across the crypto market.