|

EUR/USD technical analysis: Euro enters the New York session pressured near weekly lows

  • EUR/USD is under pressure in the first part of the New York session.
  • The level to beat for sellers is the 1.1080 support followed by the 1.1062 level.
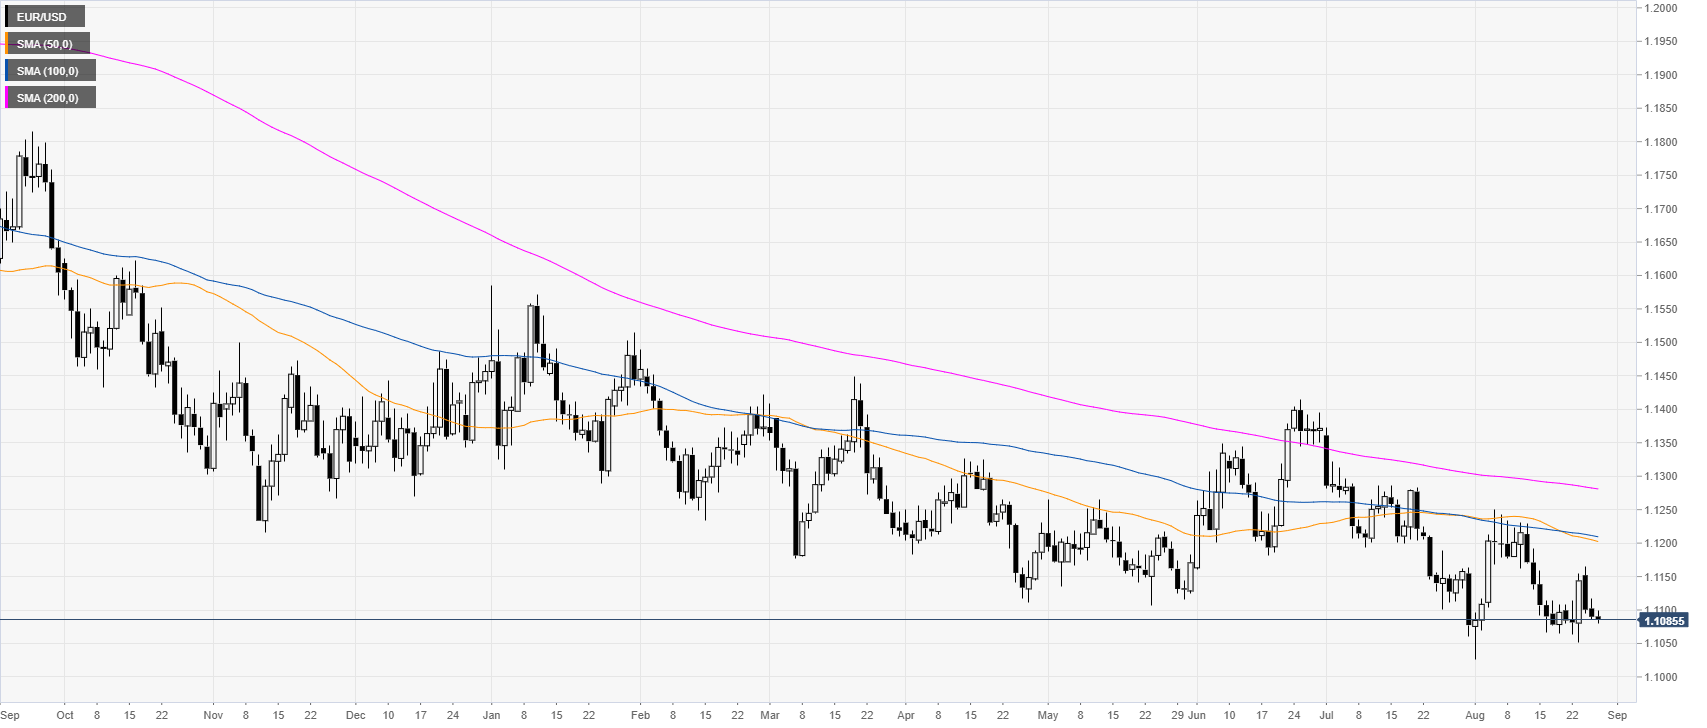


EUR/USD daily chart

 
On the daily time-frame, the single currency is trading in a bear trend below the main daily simple moving averages (DSMAs). The market is down for the third day in a row.

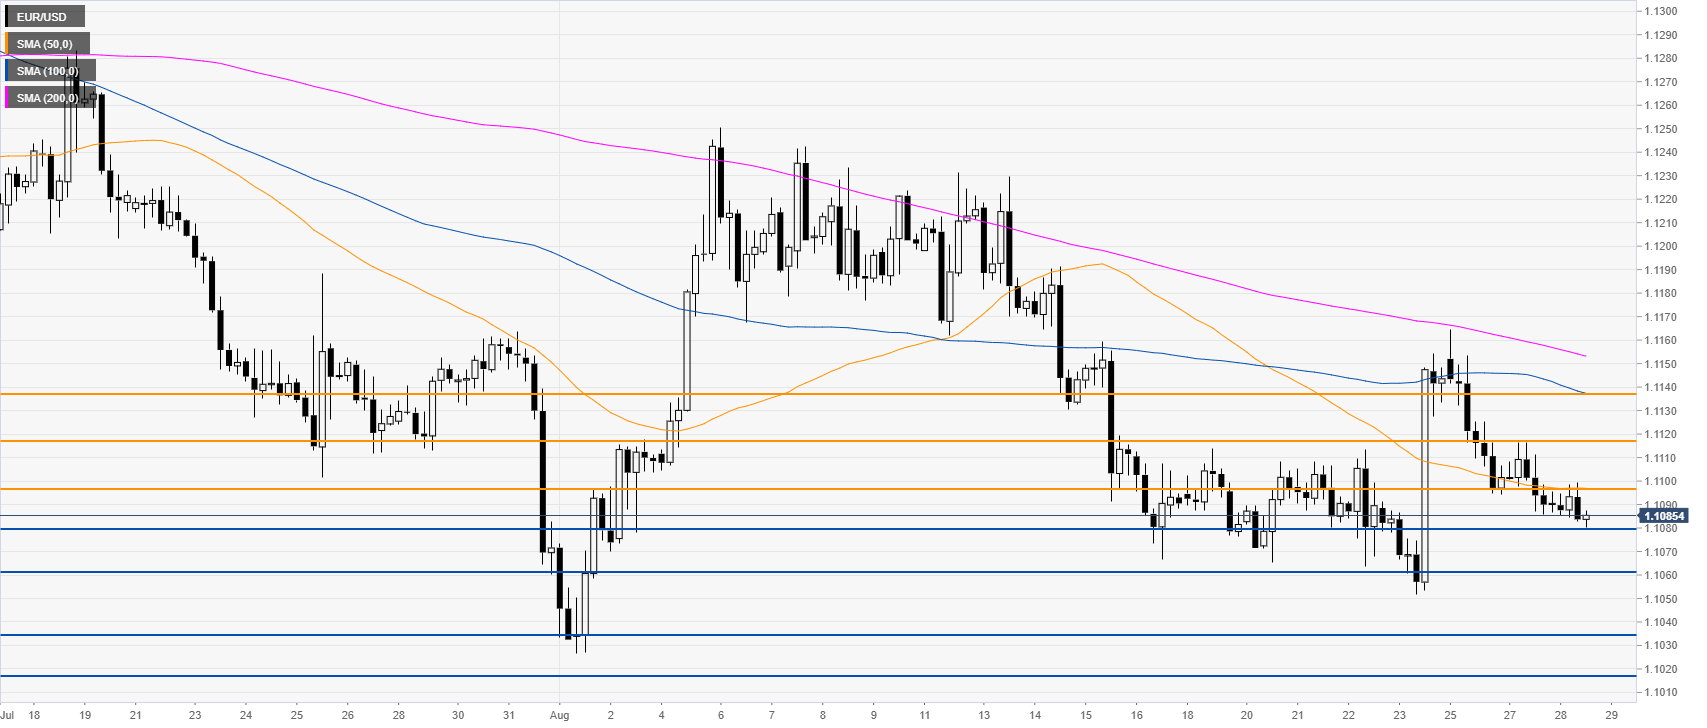
EUR/USD 4-hour chart

 
The market is slowly drifting lower below its main SMAs. Bears likely intend to break 1.1080 support to drive the market down towards 1.1062 and 1.1033 levels, according to the Technical Confluences Indicator.


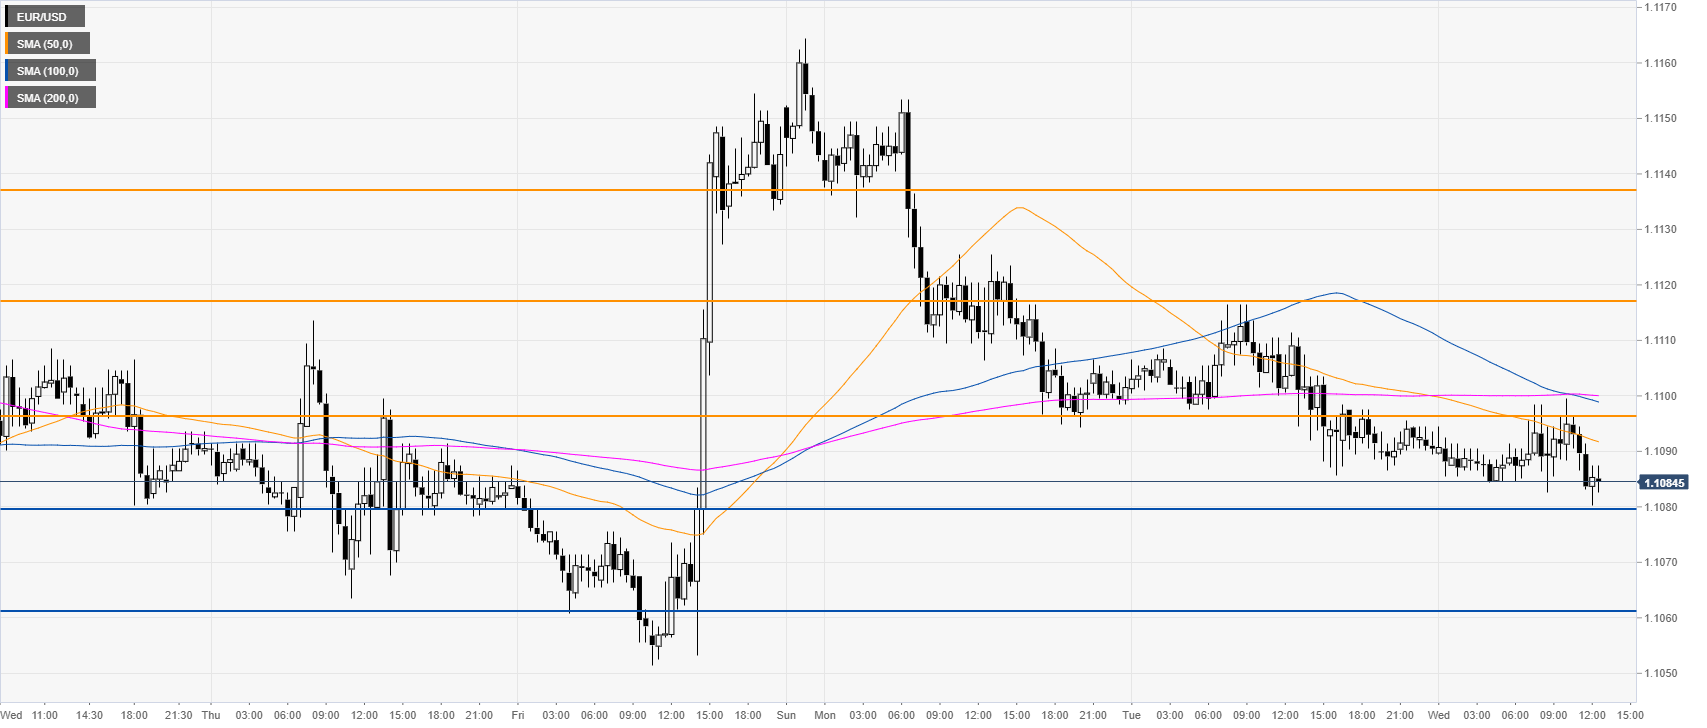
EUR/USD 30-minute chart

 
EUR/USD is near the daily lows under the main SMAs, suggesting a bearish momentum in the near term. Immediate resistance is seen at 1.1098, 1.1117 and 1.1137 levels, according to the Technical Confluences Indicator. 


Additional key levels

EUR/USD

Overview
Today last price1.1085
Today Daily Change-0.0005
Today Daily Change %-0.05
Today daily open1.109
 
Trends
Daily SMA201.1133
Daily SMA501.1205
Daily SMA1001.1211
Daily SMA2001.1282
Levels
Previous Daily High1.1116
Previous Daily Low1.1086
Previous Weekly High1.1154
Previous Weekly Low1.1052
Previous Monthly High1.1373
Previous Monthly Low1.106
Daily Fibonacci 38.2%1.1097
Daily Fibonacci 61.8%1.1105
Daily Pivot Point S11.1078
Daily Pivot Point S21.1067
Daily Pivot Point S31.1048
Daily Pivot Point R11.1109
Daily Pivot Point R21.1128
Daily Pivot Point R31.114

Author

Flavio Tosti

Flavio Tosti

Independent Analyst


More from Flavio Tosti
Share:

Editor's Picks

EUR/USD appears supported by the 200-day SMA, for now

Following an early pullback to multi-week lows near 1.1670, EUR/USD now manages to reclaim the 1.1700 region as the NA session draws to a close on Monday. The steep retracement in spot follows the equally strong move higher in the US Dollar, as investors continue to assess the geopolitical landscape in the wake of the US and Israel attacks on Iran.


GBP/USD hits new yearly lows near 1.3300

GBP/USD adds to the recent bearish tone, approaching to the key 1.3300 support to reach fresh YTD troughs against the backdrop of the robust performance of the US Dollar. Indeed, Cable’s decline comes amid the firm demand for the safe-haven space in the wake of the US and Israel attacks to Iran.

Gold eases some ground, approaches $5,300

Gold now surrenders part of the earlier advance, reshifting its attenton to the $5,300 zone per troy ounce at the beginning of the week. Indeed, the yellow metal’s firm performance appears propped up by incresing geopolitical jitters in the Middle East, which at the same time fuels the demand for the safe-haven space.

Ethereum Price Forecast: BitMine lifts ETH holdings to 4.47M, Lee predicts geopolitical impact on markets

Ethereum (ETH) treasury firm BitMine Immersion (BMNR) bought another 50,928 ETH last week, sending its stash of the top altcoin to 4.47 million ETH worth about $8.9 billion at the time of publication.

The Fed is finally talking about AI – Here's why it matters for the US Dollar

AI is moving from earnings calls into the heart of monetary policy discussions, forcing Federal Reserve officials to confront a new question: How to act if AI reshapes inflation, employment and interest rates at the same time?

Grass 20% bullish breakout defies broader market weakness

Grass (GRASS) is edging up above $0.30 at the time of writing on Monday. The token’s notable 20% intraday surge stands out amid heightened volatility in the broader crypto market.