|

EUR/USD technical analysis: Euro enters the Asian session below the 1.1098 level

  • EUR/USD is drifting below the 1.1098 level as the New York session comes to an end. 
  • The level to beat for sellers is at the 1.1080 support.
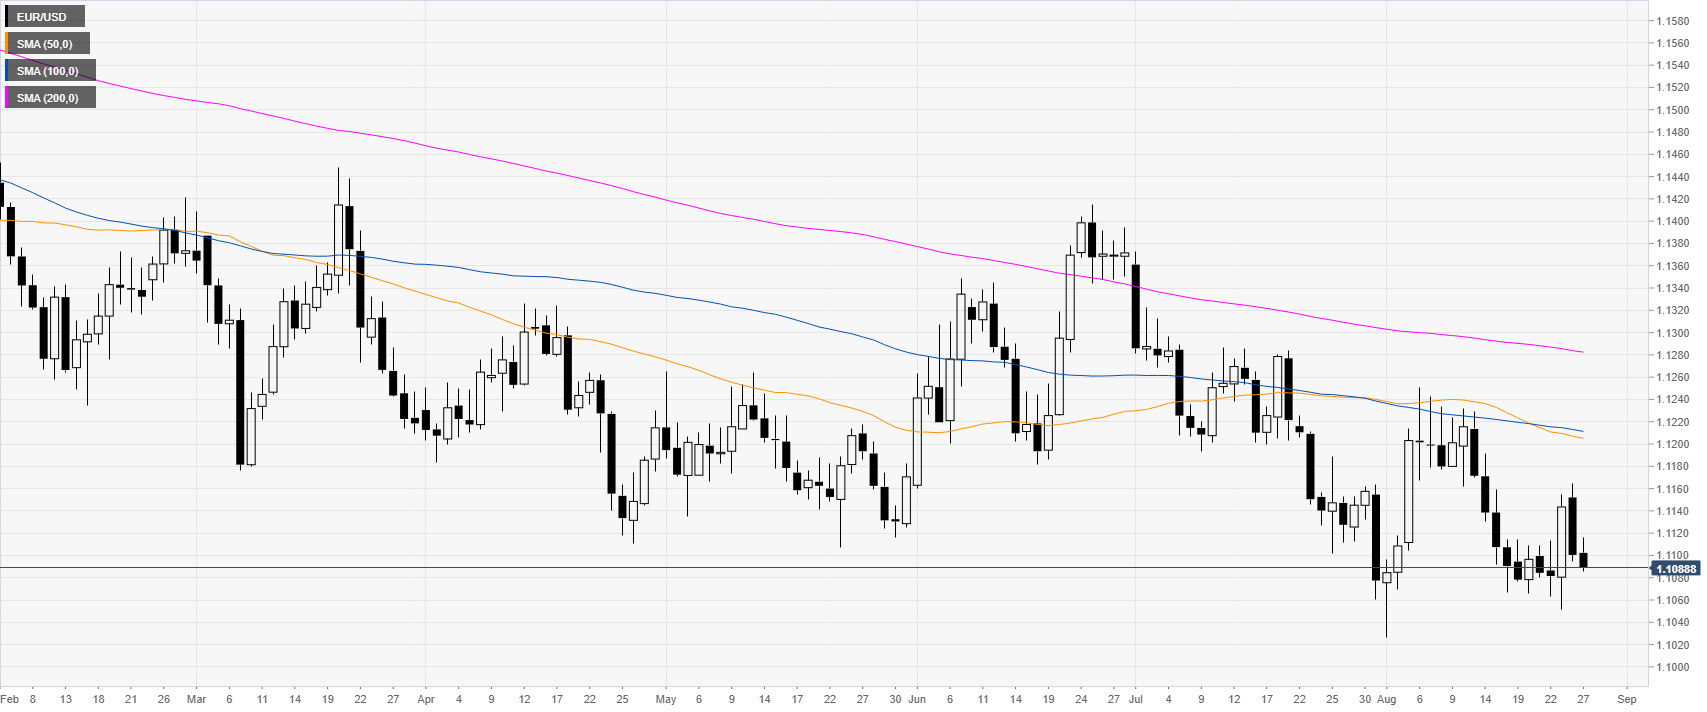


EUR/USD daily chart

 
On the daily time-frame, the common currency is trading in a bear trend below its main daily simple moving averages (DSMAs). The market is down for the second day in a row.

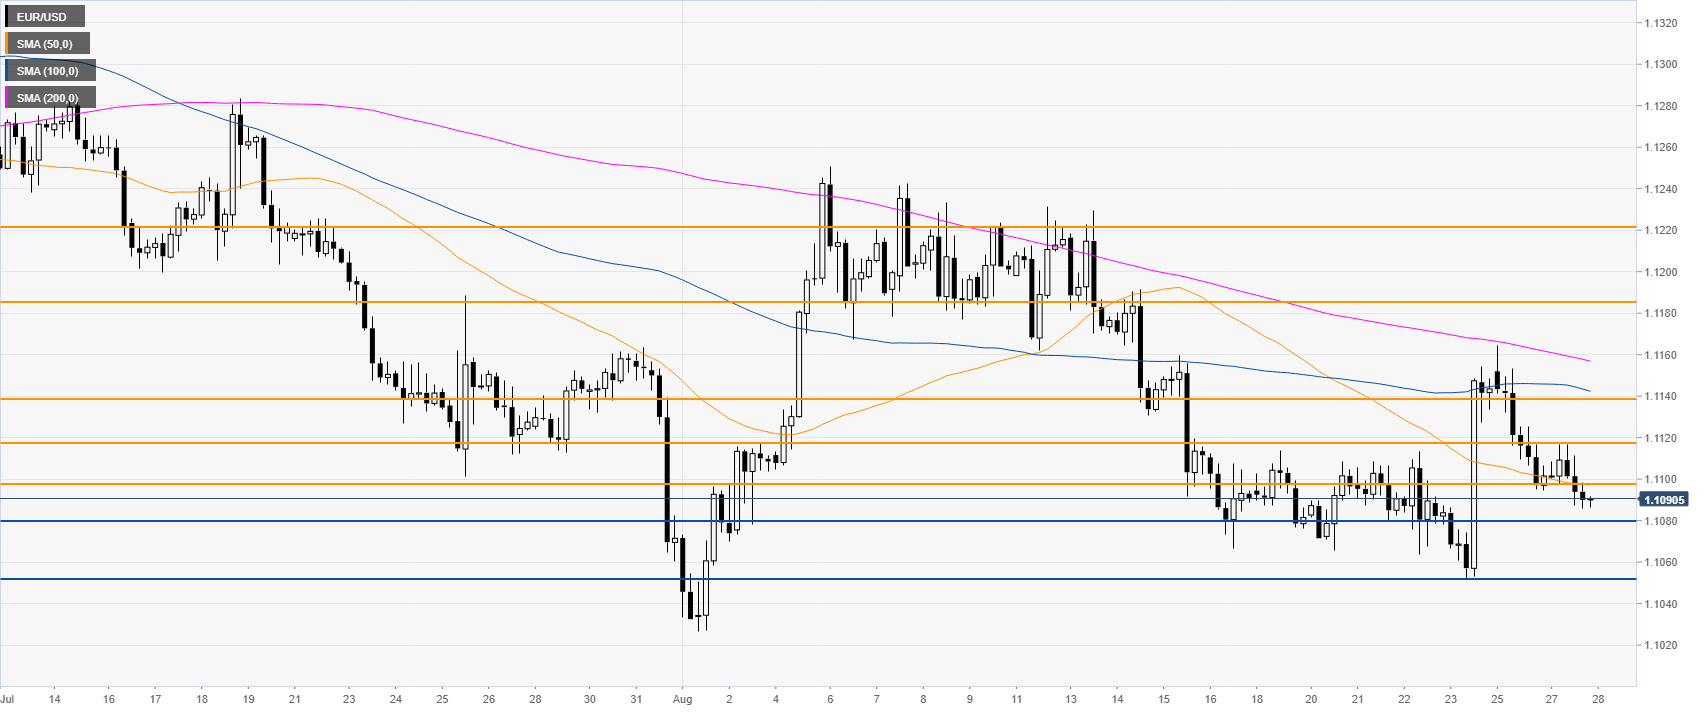
EUR/USD 4-hour chart

 
Fiber is about to close Tuesday below the 1.1098 level. If the sellers keep the pressure on, the market may decline towards the 1.1080 and 1.1052 levels, according to the Technical Confluences Indicator.


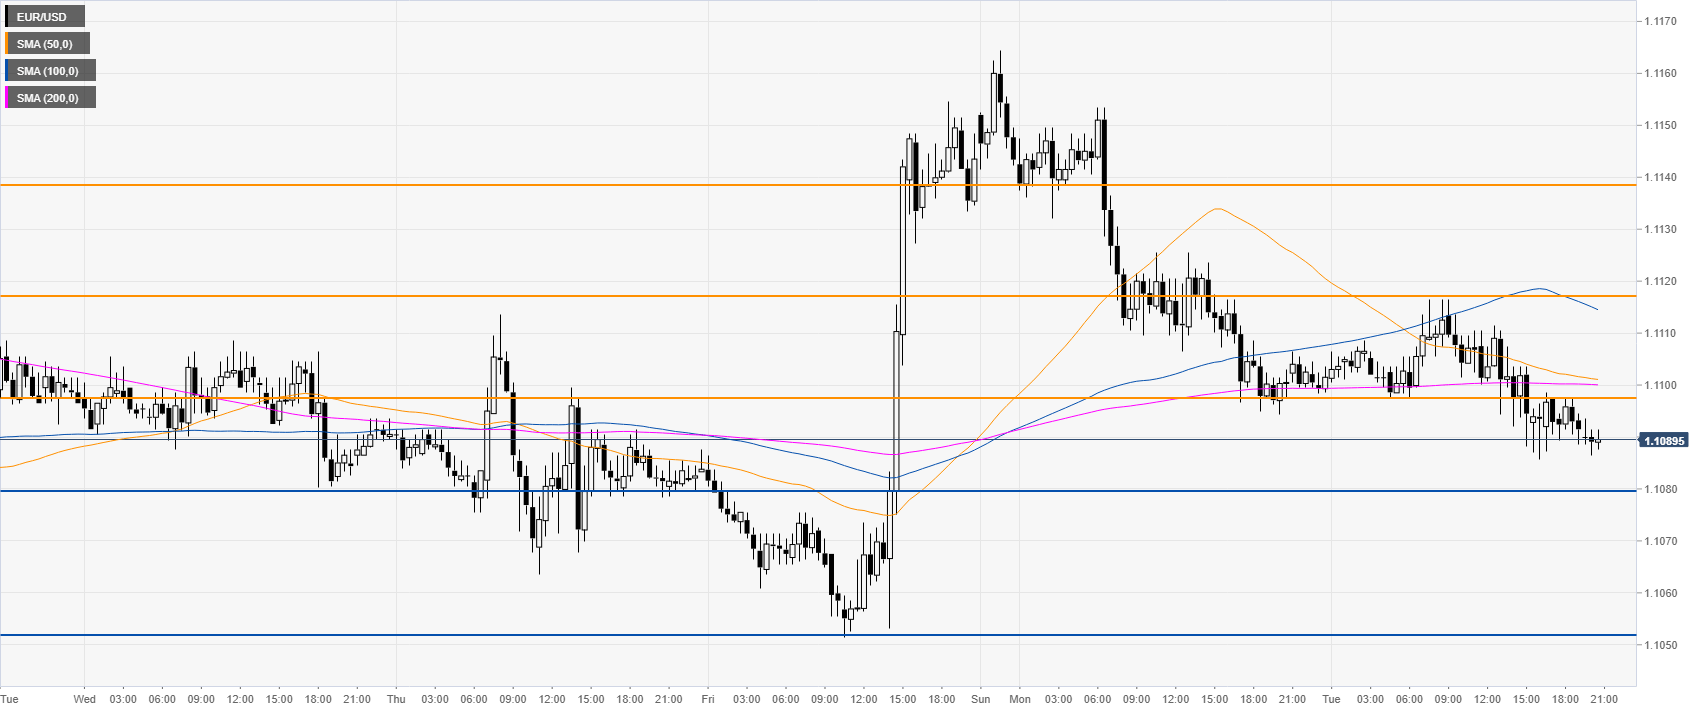
EUR/USD 30-minute chart

 
EUR/USD is trading, near the daily lows below the main SMAs suggesting a bearish momentum in the near term. The bears' move lacks commitment; therefore, it remains to be seen how the sellers will sustain the current move on Wednesday. A move back above 1.1098 could be seen as a sign of bearish weakness in the short term. Immediate resistance is seen at 1.1098, 1.1117 and 1.1134 levels, according to the Technical Confluences Indicator. 


Additional key levels

EUR/USD

Overview
Today last price1.1089
Today Daily Change-0.0011
Today Daily Change %-0.10
Today daily open1.11
 
Trends
Daily SMA201.1136
Daily SMA501.1207
Daily SMA1001.1213
Daily SMA2001.1284
Levels
Previous Daily High1.1164
Previous Daily Low1.1094
Previous Weekly High1.1154
Previous Weekly Low1.1052
Previous Monthly High1.1373
Previous Monthly Low1.106
Daily Fibonacci 38.2%1.1121
Daily Fibonacci 61.8%1.1138
Daily Pivot Point S11.1075
Daily Pivot Point S21.105
Daily Pivot Point S31.1005
Daily Pivot Point R11.1145
Daily Pivot Point R21.119
Daily Pivot Point R31.1215

Author

Flavio Tosti

Flavio Tosti

Independent Analyst


More from Flavio Tosti
Share:

Editor's Picks

EUR/USD looks apathetic around 1.1770

EUR/USD comes under renewed pressure on Tuesday, deflating below the 1.1800 support and reversing two consecutive days of gains. The pair’s decline follows the persistent move higher in the US Dollar, as trade uncertainty dominates the sentiment ahead of President Trump’s SOTU speech.

GBP/USD regains 1.3500 and above

GBP/USD extends its advance for the third day in a row on Tuesday, this time retesting the area beyond the 1.3500 hurdle. Cable’s uptick comes despite decent gains in the Greenback and the dovish message from the BoE’s Bailey at the UK Parliament.

Gold appears offered around $5,150

Gold is giving back a good portion of the recent multi-day rally, receding to the $5,150 zone per troy ounce amid the decent bounce in the US Dollar and mixed US Treasuty yields. In the meantime, markets’ attention remain on upcoming comments from Fed speakers.

Crypto Today: Bitcoin, Ethereum, XRP come under renewed pressure amid ETF outflows, tariff uncertainty

Bitcoin, Ethereum and Ripple are trading under increasing selling pressure at the time of writing on Tuesday, as market participants navigate renewed tariff uncertainty. The Crypto King holds above $63,000, down 2% intraday from its $64,656 open.

The Citrini report: How a debatable AI narrative can shake Wall Street

That AI-related headline alone was enough to rattle investors.US stocks slid sharply on Monday after a widely circulated Citrini Research memo outlined a hypothetical “2028 Global Intelligence Crisis”, warning that rapid AI adoption could push US unemployment into double digits as early as by mid-2028.

XRP pressured by weak ETF flows and declining retail interest

Ripple (XRP) is edging lower, trading above its intraday low of $1.32 at the time of writing on Tuesday. The decline from its weekly opening of $1.39 reflects heightened volatility in the broader cryptocurrency market, accentuated by tariff-triggered uncertainty.