|

EUR/USD Price Analysis: Will the pair reach parity ahead of the weekend?

  • The EUR/USD breached the 1.0100 mark; a daily close below 1.0096 paves the way towards parity.
  • In the near term, the EUR/USD could print a leg-up towards 1.0120-30, before re-testing parity.

The EUR/USD slides below the 1.0100 figure for the first time since July 27, as EUR sellers eye a daily close below 1.0096, which could pave the way for a re-test of the pair’s parity. At the time of writing, the EUR/USD is trading at 1.0089, well below its opening price, after reaching a daily high of 1.0184.

EUR/USD Price Analysis: Technical outlook

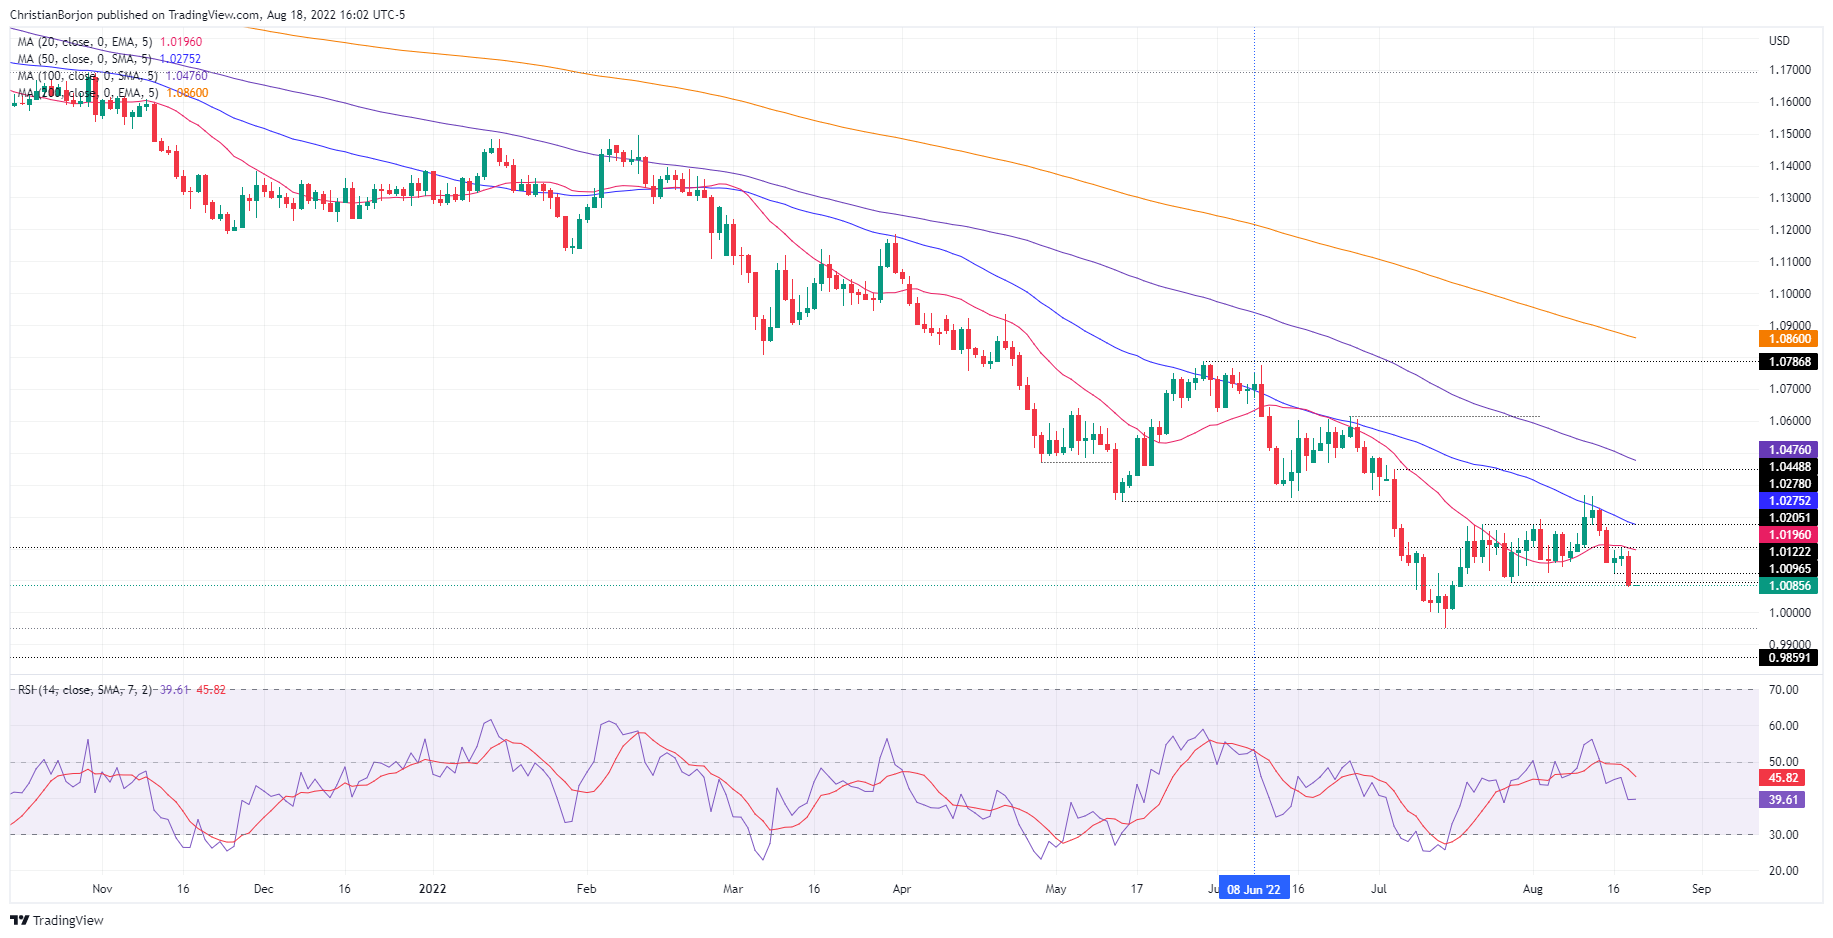
Since the beginning of the week, the EUR/USD began its free fall, from around 1.0268, exacerbated by the release of important US economic data. That, alongside the release of the FOMC minutes, were the reasons for initial EUR weakness. Nevertheless, buyers hold the fort around 1.0100 before giving way to EUR/USD sellers.

On Thursday, the EUR/USD broke below the July 27 daily low at 1.0096, positioning sellers before launching an assault towards parity. The Relative Strength Index (RSI) at 39.65, pointing downwards, provides enough room for sellers before reaching oversold conditions.

Therefore, the EUR/USD’s next support would be July’s 8 daily low at 1.0078. Once cleared, there’s nothing in the way for a re-test of 1.0000, followed by the YTD low at 0.9952.

EUR/USD Daily chart

In the one-hour scale, the EUR/USD is also downward biased, but the Relative Strength Index (RSI) at oversold territory might suggest the pair can print a leg-up before resuming the downtrend. If the EUR/USD jumps above the 1.0099 intraday swing high, that could exacerbate a move towards August’s 16 low at 1.0122 or to the 50% Fibonacci retracement at 1.0133. Once that’s said and done, a fall towards 1.0000 is on the cards.


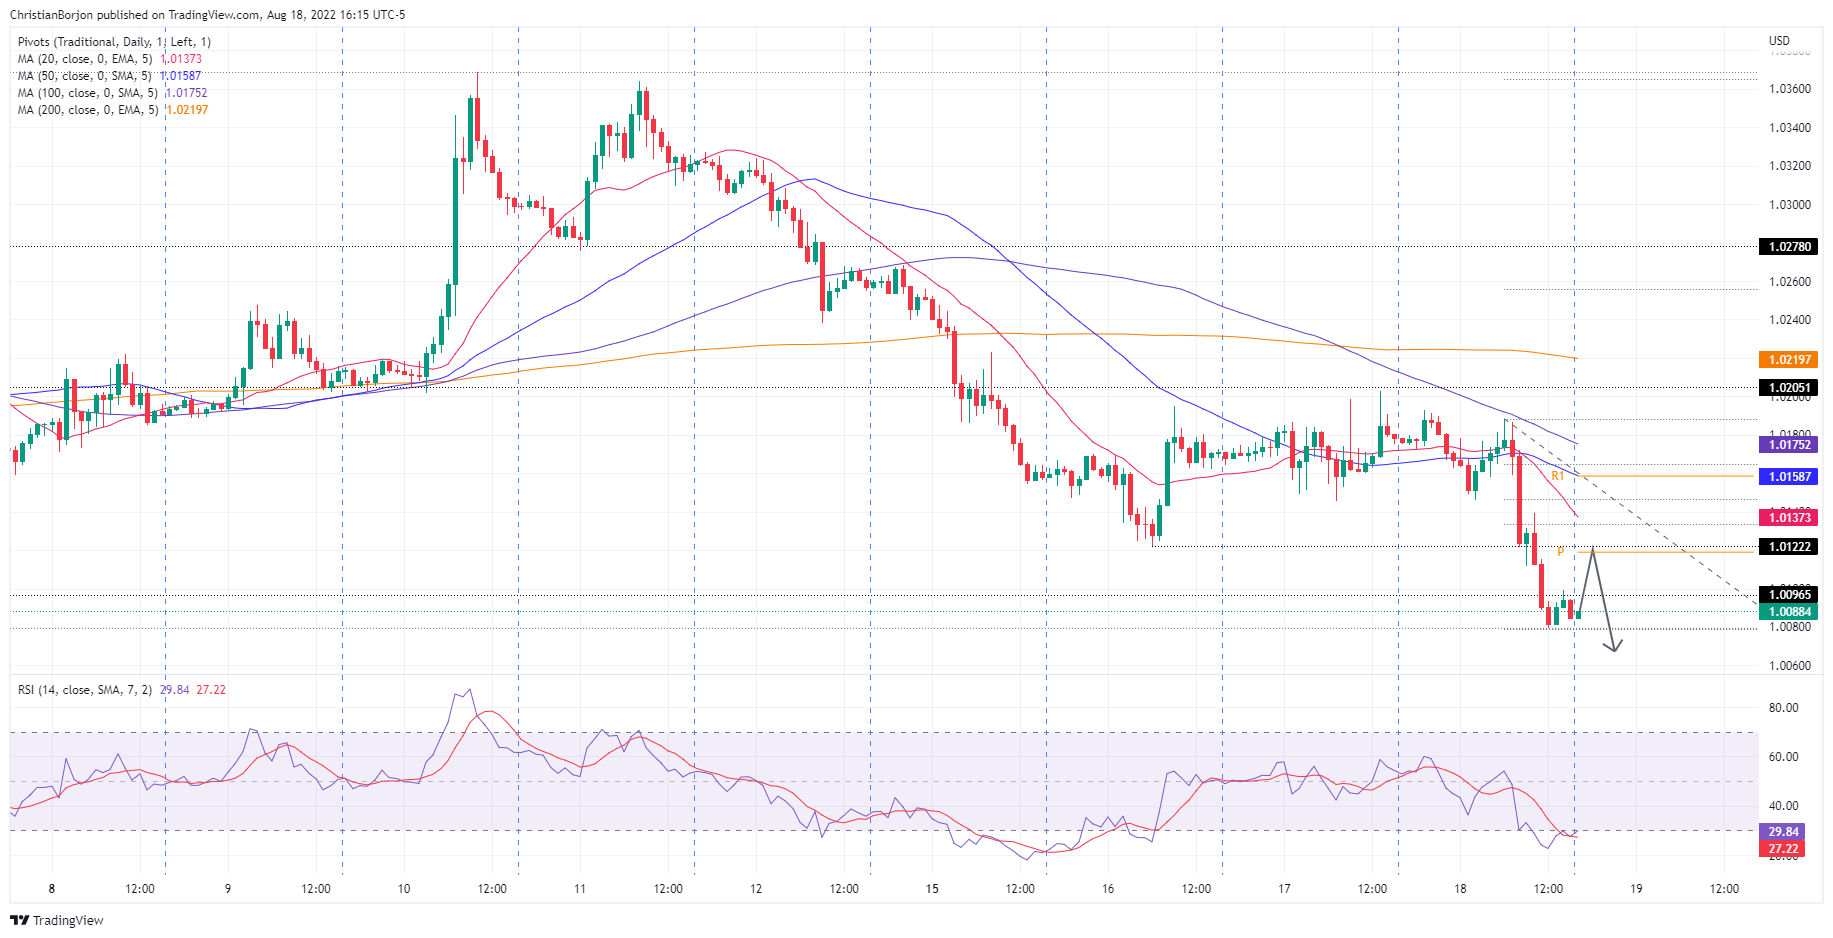
EUR/USD Hourly chart

EUR/USD Key Technical Levels

EUR/USD

Overview
Today last price1.0084
Today Daily Change-0.0091
Today Daily Change %-0.89
Today daily open1.018
 
Trends
Daily SMA201.0211
Daily SMA501.0297
Daily SMA1001.0498
Daily SMA2001.0875
 
Levels
Previous Daily High1.0203
Previous Daily Low1.0146
Previous Weekly High1.0369
Previous Weekly Low1.0159
Previous Monthly High1.0486
Previous Monthly Low0.9952
Daily Fibonacci 38.2%1.0181
Daily Fibonacci 61.8%1.0167
Daily Pivot Point S11.015
Daily Pivot Point S21.0119
Daily Pivot Point S31.0092
Daily Pivot Point R11.0207
Daily Pivot Point R21.0234
Daily Pivot Point R31.0265

Author

Christian Borjon Valencia

Markets analyst, news editor, and trading instructor with over 14 years of experience across FX, commodities, US equity indices, and global macro markets.

More from Christian Borjon Valencia
Share:

Editor's Picks

EUR/USD remains bid near 1.1650 post-US ADP

Finally some respite for the risk complex see EUR/USD partially recover from the recent steep sell-off, this time hovering around the 1.1650 zone amid decent gains in a context of renewed selling pressure on the US Dollar. However, the duration and extension of this bounce should be put to the test amid the unabated tensions in the Middle East.

GBP/USD meets resistance around 1.3400

In line with its risk-linked peers, GBP/USD stages a modest comeback on Wednesday, although meeting some resistance around the 1.3400 neighbourhood. Cable’s humble recovery comes on the back of the fresh downward bias in the Greenback amid a marginal improvement in the global sentiment and steady geopolitical effervescence.

Gold flirts with $5,200 amid safe haven demand

Gold partially fades Tuesday’s sharp pullback, regaining the $5,200 mark per troy ounce on the back of the resurgence of investors’ demand for the safe-haven space. The precious metal remains well propped up by the deterioration of the geopolitical scenario in the Middle East, while the softer tone in the US Dollar collaborates with the uptick.

Crypto Today: Bitcoin, Ethereum, XRP rebound amid mixed ETF flows

The cryptocurrency market is showing subtle recovery signs despite heightened global uncertainty following the United States (US) and Israel attacks on Iran and the subsequent retaliations that have morphed into a wider Middle East war.

First Venezuela, now Iran: The US-China energy war escalates

At first glance, the latest escalation involving the United States with both Iran and Venezuela looks like another chapter in a long-running geopolitical story. But viewed through a broader strategic lens, something else may be unfolding: Energy.

Solana Price Forecast: SOL consolidation near resistance as ETF inflows offer mild support

Solana price is facing slight rejection as it approaches the upper boundary of the consolidation range at around $88 on Wednesday. Institutional demand is strengthening as spot Exchange Traded Funds recorded two consecutive inflows so far this week.