EUR/USD Price Analysis: Weekly bullish M-formation is starting to play out
- EUR/USD is higher by some 0.6% in a corrective phase.
- The bulls are noting the weekly M-formation.
EUR/USD has been in a downward spiral since the end of May 2021, moving below the 200 DMA late to mid-June of last year. The price has fallen to as low as 1.07573, or around the 2020 April supporting area. This is an important area of demand as it led to the May 2020-Jan 2021 rally:
EUR/USD daily chart
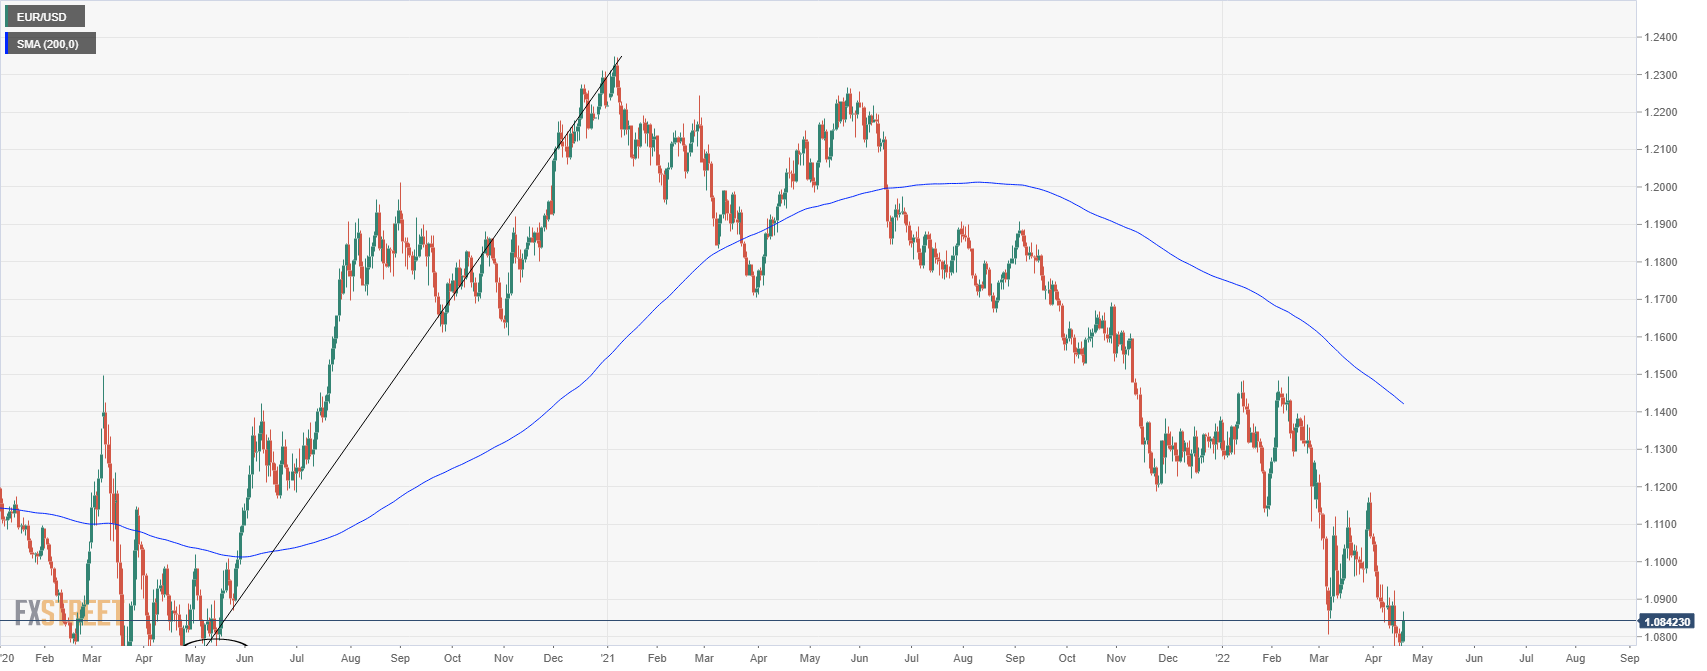
Given this level of support, a correction would be expected and we are starting to see that in today's price action.
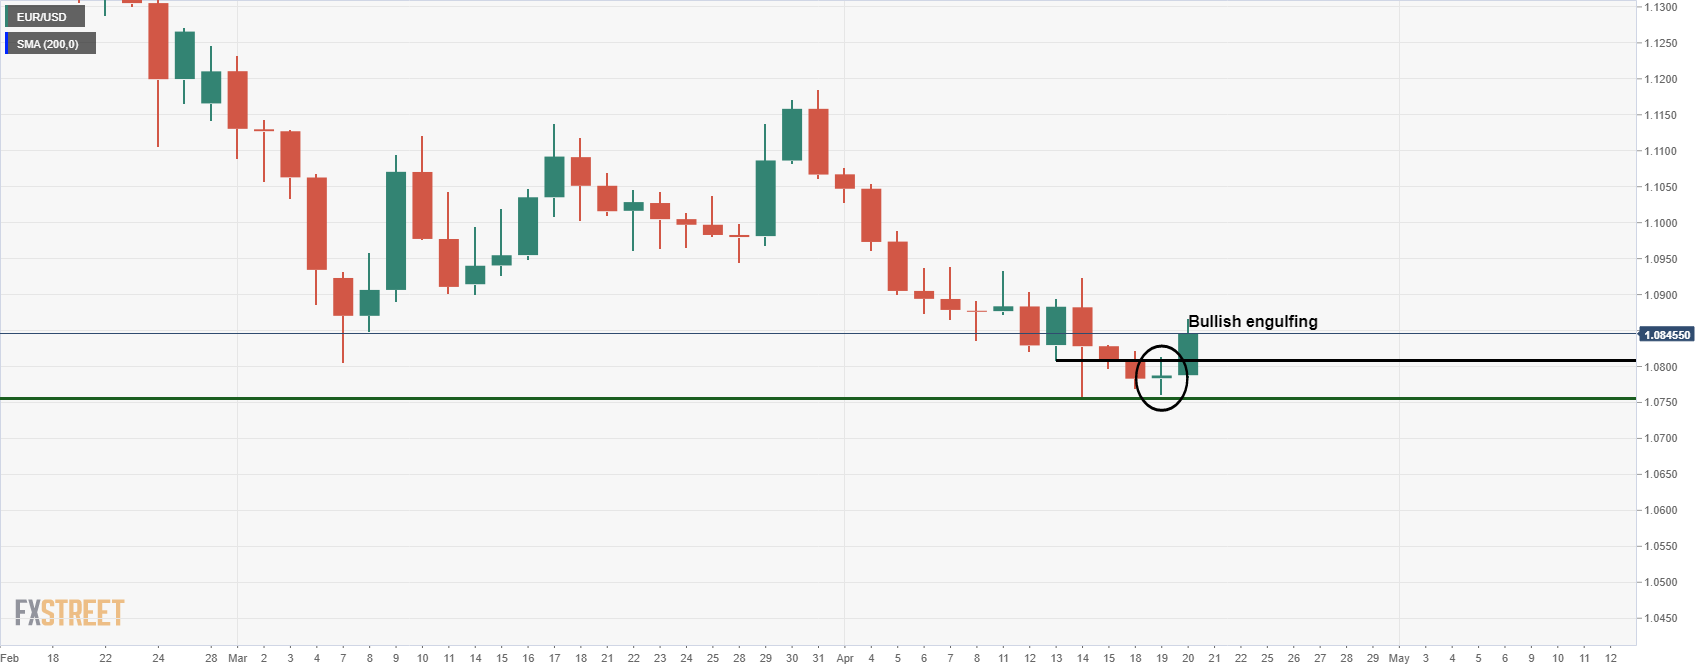
EUR/USD's Doji candle followed by a bullish engulfing candle is a bullish candlestick formation that has taken out the prior support on a closing basis.
Meanwhile, from a weekly perspective, the M-formation is another bullish feature on the charts.
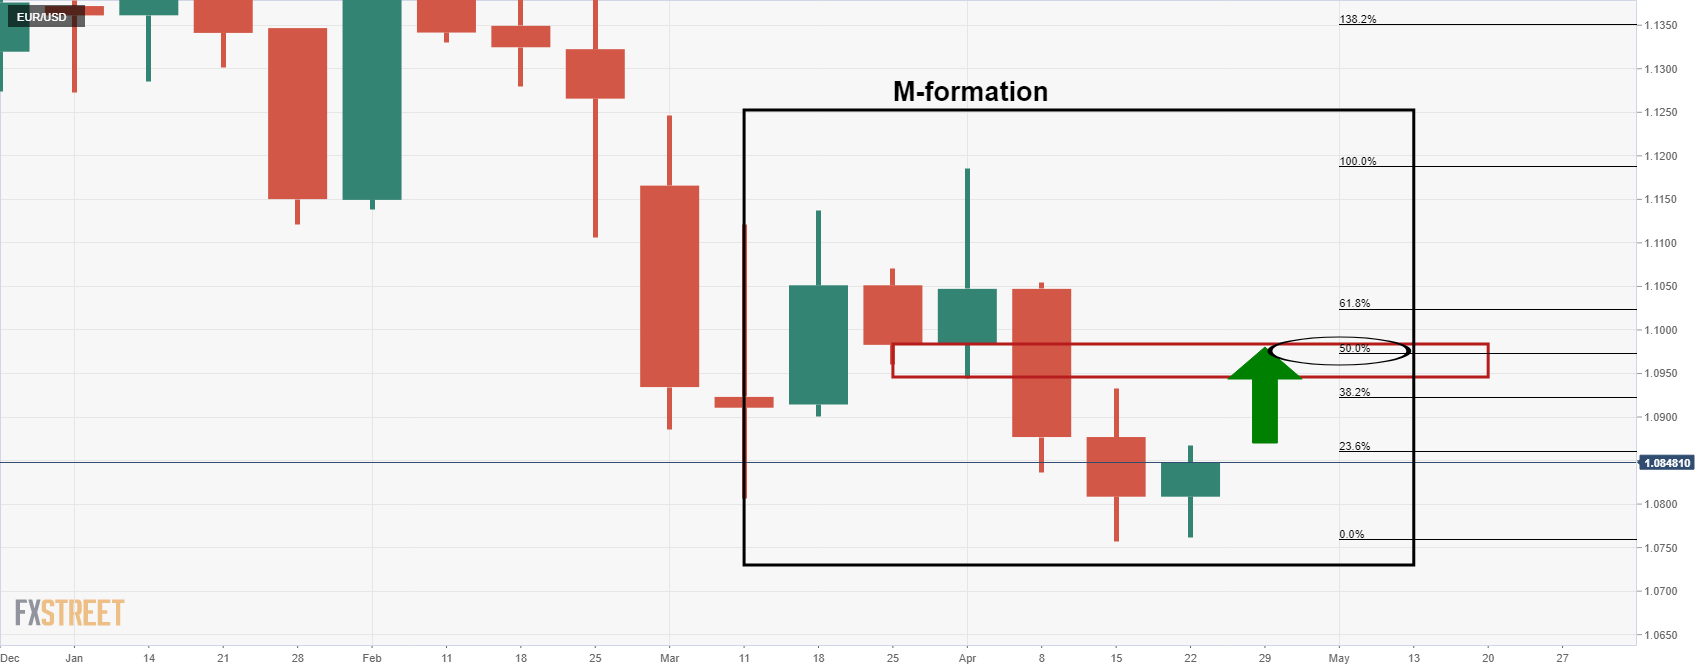
This is a reversion pattern and the price would be expected to revert back to test the old lows, (the neckline). In this scenario, the neckline is the 50% mean reversion level.
Author

Ross J Burland
FXStreet
Ross J Burland, born in England, UK, is a sportsman at heart. He played Rugby and Judo for his county, Kent and the South East of England Rugby team.


